Categories
Fun HowTo

Importing a WhatApp-Conversation in R

I recently saw some people on Reddit analyzing their chat-conversations and I wanted to try it too. You can export a Whatsapp-Conversation by sending it as an Email to yourself. You will receive a txt-File with all the conversations. Because it isn’t formatted in a useful manner, you have to do it yourself. I will do this in this post and analyse the data in a second one. So this will be a bit more technical than usual. You can find the complete code here.

Categories
Europe Fun Map Population

A dot-map of Europe

This map is a more leaning on the aesthetic- then data-side. The size of the dots correlates with the size of the population in that place. The color has no meaning and is just there to look nice. For the division of places I used the NUT3 standard which is quite useful, but has its problems if you use it to compare countries.

Categories
Chart Germany Switzerland

How many pigs live in Switzerland, Austria and Germany?

31’642’218 pigs lived in Austria, Switzerland and Germany combined, if we trust the numbers of the statistical ministries. I recently saw that governments release the numbers of farm-animals in a country.

Categories
Map Switzerland

The Trams of Zurich animated

After I saw a great post on /r/dataisbeautiful where someone mapped a place with the help of location-data of rented bicycles, I searched if there is some similar data available where I live.

Categories
Europe Fun Map

Where have I been in 2017

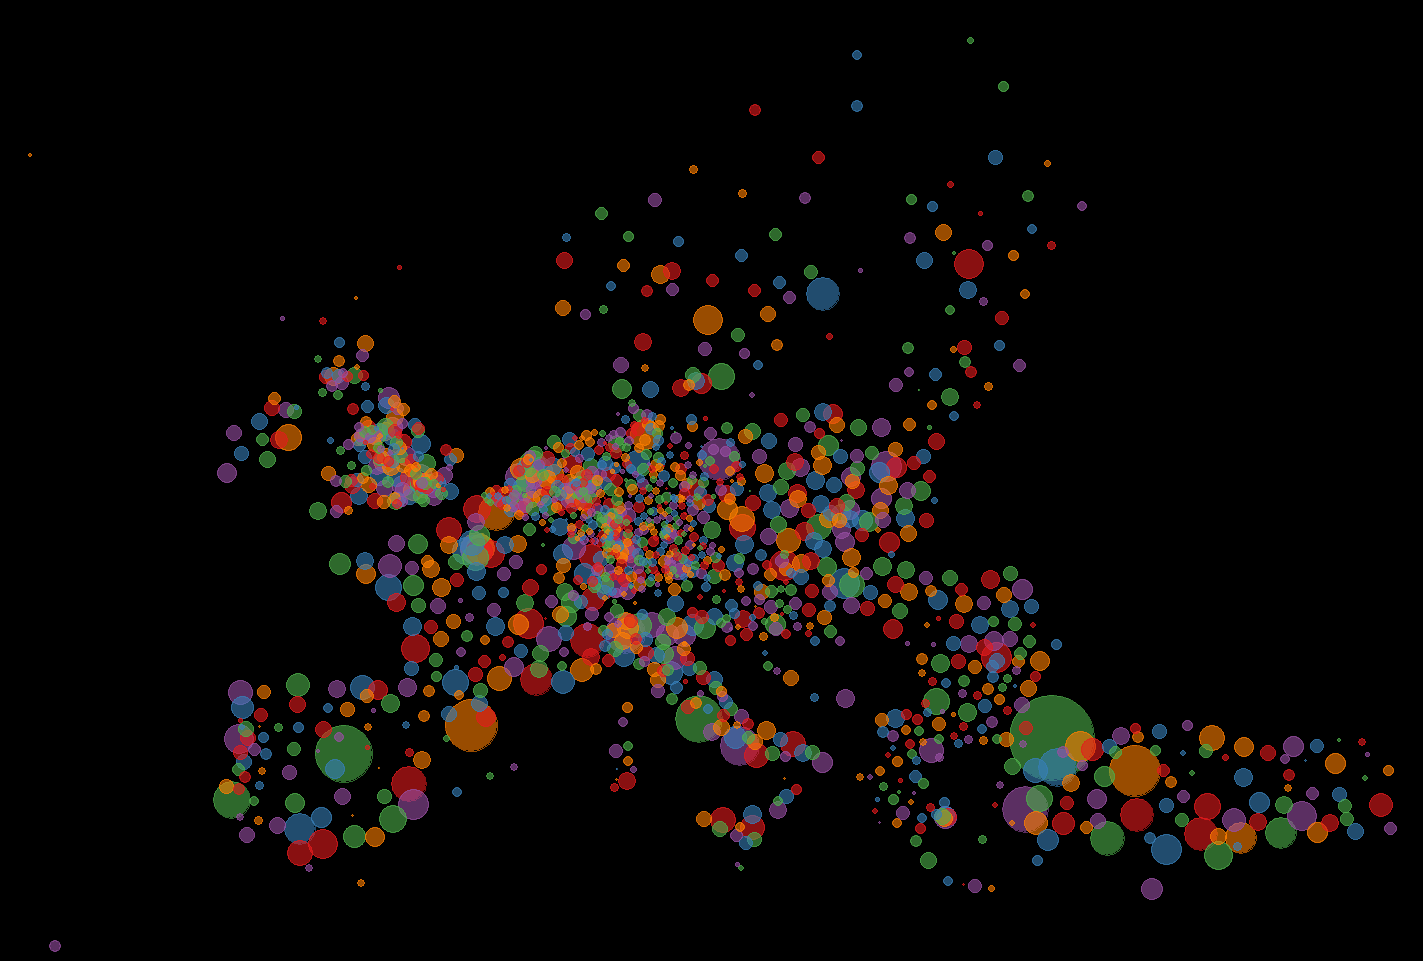
I created this animation in the first days of 2018. A few years ago I accepted that most of my data is stored somewhere. Instead of avoiding this like before, I started to embrace it. In Google Locations for example all the places where you have been are stored (if you didn’t disable it). It can be quite useful to remember what you did a certain day.

This data can also be downloaded and analysed. I didn’t do that, I just wanted to make a nice animation. To do thso at I imported the data it into R with the help of the json-Library. I just chose one value for each day and exported that new data. The next steps could have been done in R too, but I was less experienced with the program back then.

I imported the data to QGIS instead. With the help of the TimeManager-Plugin I exported a frame for each day. I loaded those into Hitfilms Express, which is a fantastic free video-editing software. I used gifmaker.me before to create Gifs, but they have a limit of 300 frames. I exported the video and uploaded it to Gfycat. And here it is.


Categories
Chart Europe Population

Growth of European Countries relative to 1950


How did the populations of European countries grow after the end of the 2nd world-war? To answer this question I downloaded population-data from the United Nations. I picked 1950 as my default year and looked how it developed from there.

Categories
Europe Map

Population Density in Europe

This map was made with the help of the data of Eurostat. The subdivisions of the countries follows NUTS 3 standards. I used a quantil-scale, which means each colors has about the same number of regions.

Categories
Map World

Share of women in parliaments all over the world

The worldwide average for representation of women in national parliaments is about 21 percent. This number isn’t great. But 1990 the average was about 10 percent. We made at least some progress, even though there is a lot of space for improvement. Even in Europe with the highest average it’s just about a quarter.

Categories
Chart Population Switzerland

The relation of the Swiss immigration-referendum and the share of foreigners

Foreigners-ImmigrationReferendum

In 2014 Switzerland had a referendum about the initiative “against mass immigration”. I passed with 50.33 percent to the surprise of most people. The result caused a turmoil in Swiss politics. The goal of the initiative was to introduce upper limits for immigration. This seemed to contradict the Schengen-agreement with the European Union. Implementing it would probably mean the end of free movement and risk the Bilateral treaties with the EU, which are an important pillar of the economic success of Switzerland.

Categories
Chart Europe Germany Population

Which European country has the highest share of foreign born population?


For this graph I was interested in which countries had the highest immigration in recent times. I used data from the European Census 2011. Unfortunately the data is a bit old and there doesn’t exist a new version yet. Because Asia can mean a lot of things, I checked from which countries the most people come from. I didn’t count Russia as Asian here.

Because the numbers are quite old, I looked into recent numbers from Germany, where many would expect the most change. I found the Data on the website of the federal bureau for statistics. Unsurprisingly the number of immigrants has risen.