In the last post I showed how I imported a Whatsapp-conversation and tidied it up a bit. Now I want to analyze it. For that I will use the libraries dplyr, stringr and ggplot2.
As a first step, I format the dates properly and create some new columns. I also decide to just focus on two years, 2016 and 2017.
data=data%>%mutate(
  #convert DAte to the date format.
        Date=as.Date(Date, "%d.%m.%y"),
        year = format(Date,format="%y"),
        hour =  as.integer(substring(Time,1,2))
        #I filtered for two year, 2016/17
        )%>%filter(year=='17'|year=='16')
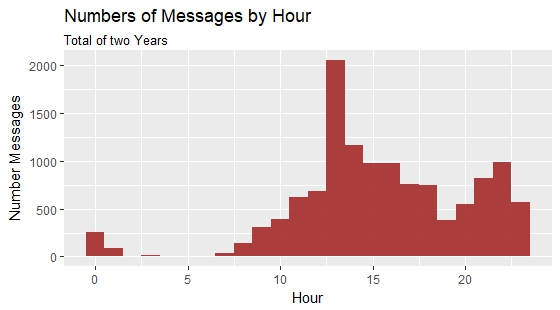
ggplot(data,aes(x=hour))+
  geom_histogram(fill="brown",binwidth=1,alpha=0.9)+
  labs(title="Numbers of Messages by Hour", subtitle="Total of two Years",
       y="Number Messages", x="Hour")
See more about the writing behavior of me an my friend, there is more formatting necessary. The words need to be counted too. To do so I use the stringr-library with str_count(data$Message, "\\S+")