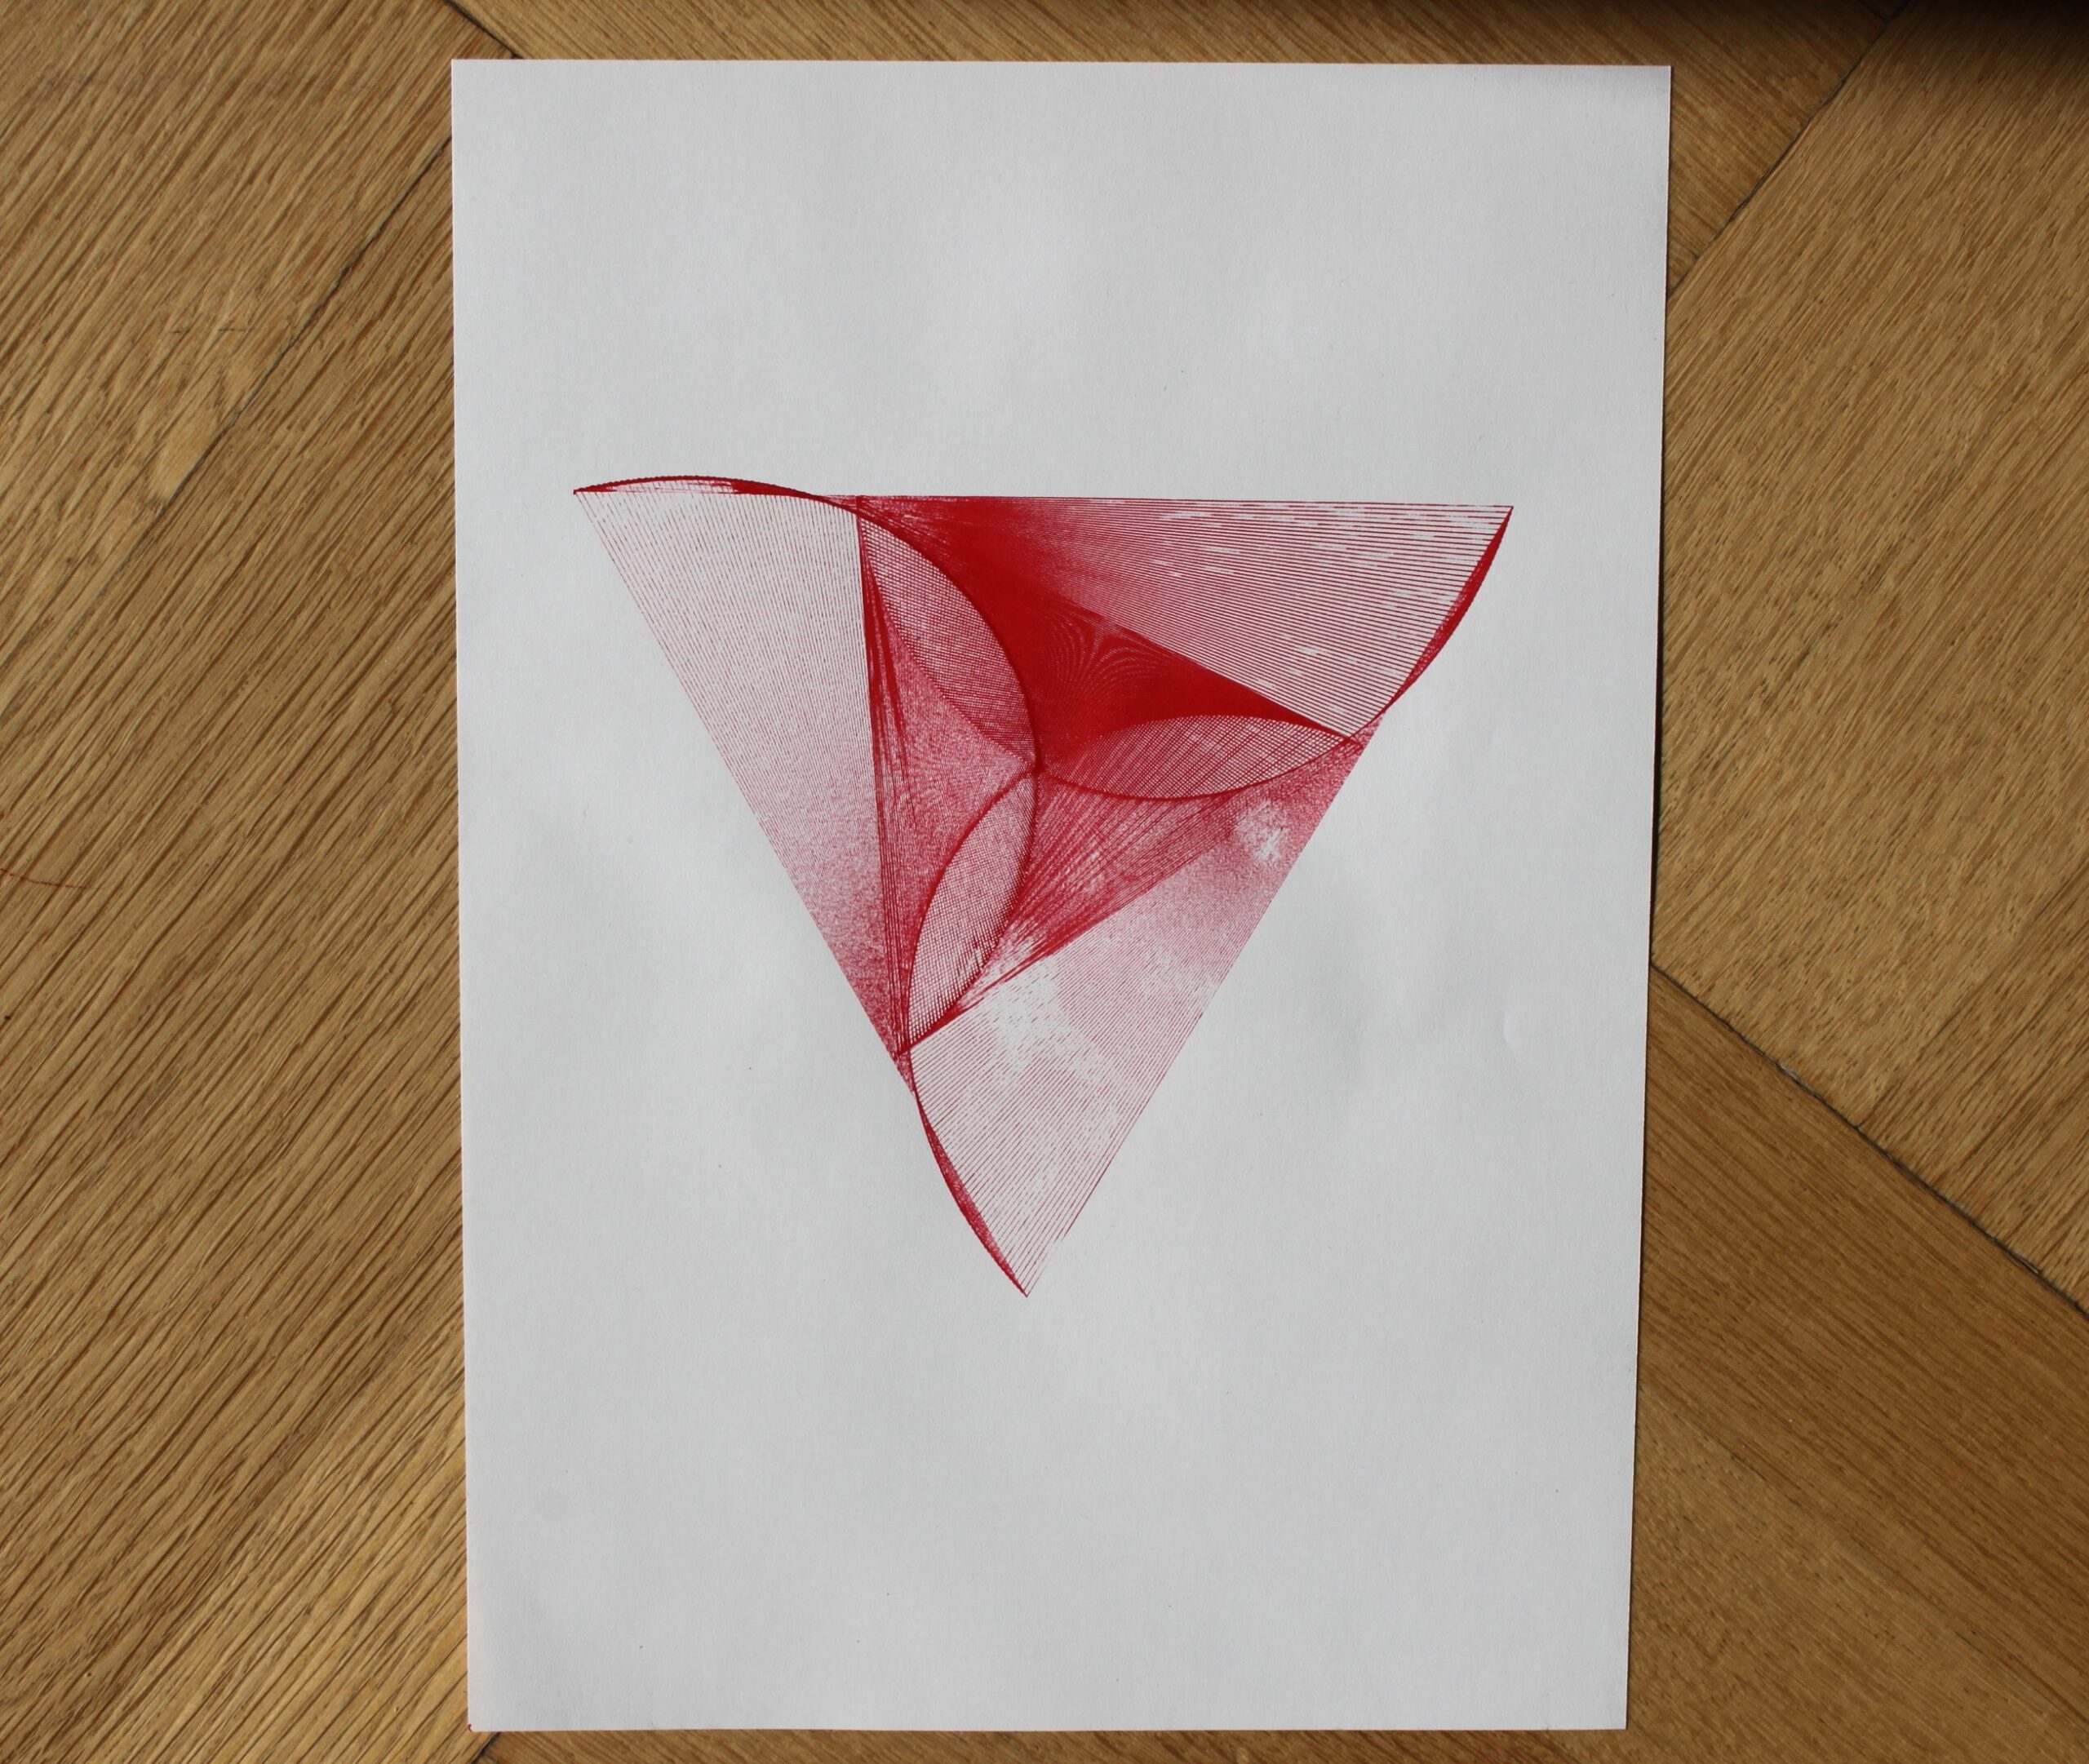
Pen plotting is a fantastic way to create unique artworks and designs. There are a lot of things to find out and get the hang of, this guide should help. I am using an Axidraw pen plotter, but most advice should be useful for other plotters too.
This was originally planned as a handout after a workshop for pen plotting I wanted to give. It didn’t happen, so maybe other people can learn from it.
People who just got a pen plotter and started to play around, will probably find this most useful.
Checklist before starting a plot
- Open and check SVG file:
- Is the correct format set (e.g. A4, landscape)?
- Are the correct colors enabled/disabled?
- Check settings (speed, pen height,etc.)
- Check work area:
- Is the correct pen inserted and secured?
- Is the paper flat and nothing hidden under it?
- Is the paper well fixed?
- Is there nothing in the way of the plotter arm?
- Start printing. Ideally, wait until the first lines are drawn to make sure you didn’t miss something.
Things to know when working with a pen-plotter (AxiDraw)
- The servo motor lifts and lowers the pen, but it does not press onto the paper (use a weight when more pressure is needed)
- The pen-plotter draws lines, it can’t fill areas like the bucket in paint (use hatching instead).
- A running plot can only be interrupted with the button on the plotter. You can continue in Inkscape under “Axi Draw Control” → Resume.
- It is worth making a small test print before starting a 8h plot when trying something new.
- Servos wear out, it is worth having a reserve, especially when you do plots that take a long time (there is now a new version, which is quieter and lives longer)
Possible problems when plotting
- Paper is not properly aligned with Plotter. (Draw lines on the surface under the Plotter for orientation)
- Plotter / Paper / Surface is moving due to the movement of the pen-plotter.
- Paper roughens up / gets holes from many pen strokes (use stronger paper, different pen, optimize file to reduce repeating lines)
- When using multiple pens, pay attention to pen diameters (the tips might not have the same position, which might lead to misalignment)
- Computer goes into sleep mode during print (change the settings on your computer to a longer time)
- Surface not evenly flat → strokes don’t have the same thickness / darkness
- Certain pens may need additional weight to draw evenly
- Different colors can bleed into each other, depending on pen, color sequence matters
Pen Selection
- Pens with hard tips work best, as they don’t wear down and move evenly.
- Fiber tips (such as Stabilos) wear down depending on the surface.
- Certain pens will fade over time. (to avoid use pen that are sun proof )
- With certain pens, the plot speed makes a difference to the result (slow movement, more ink can flow from the pen)
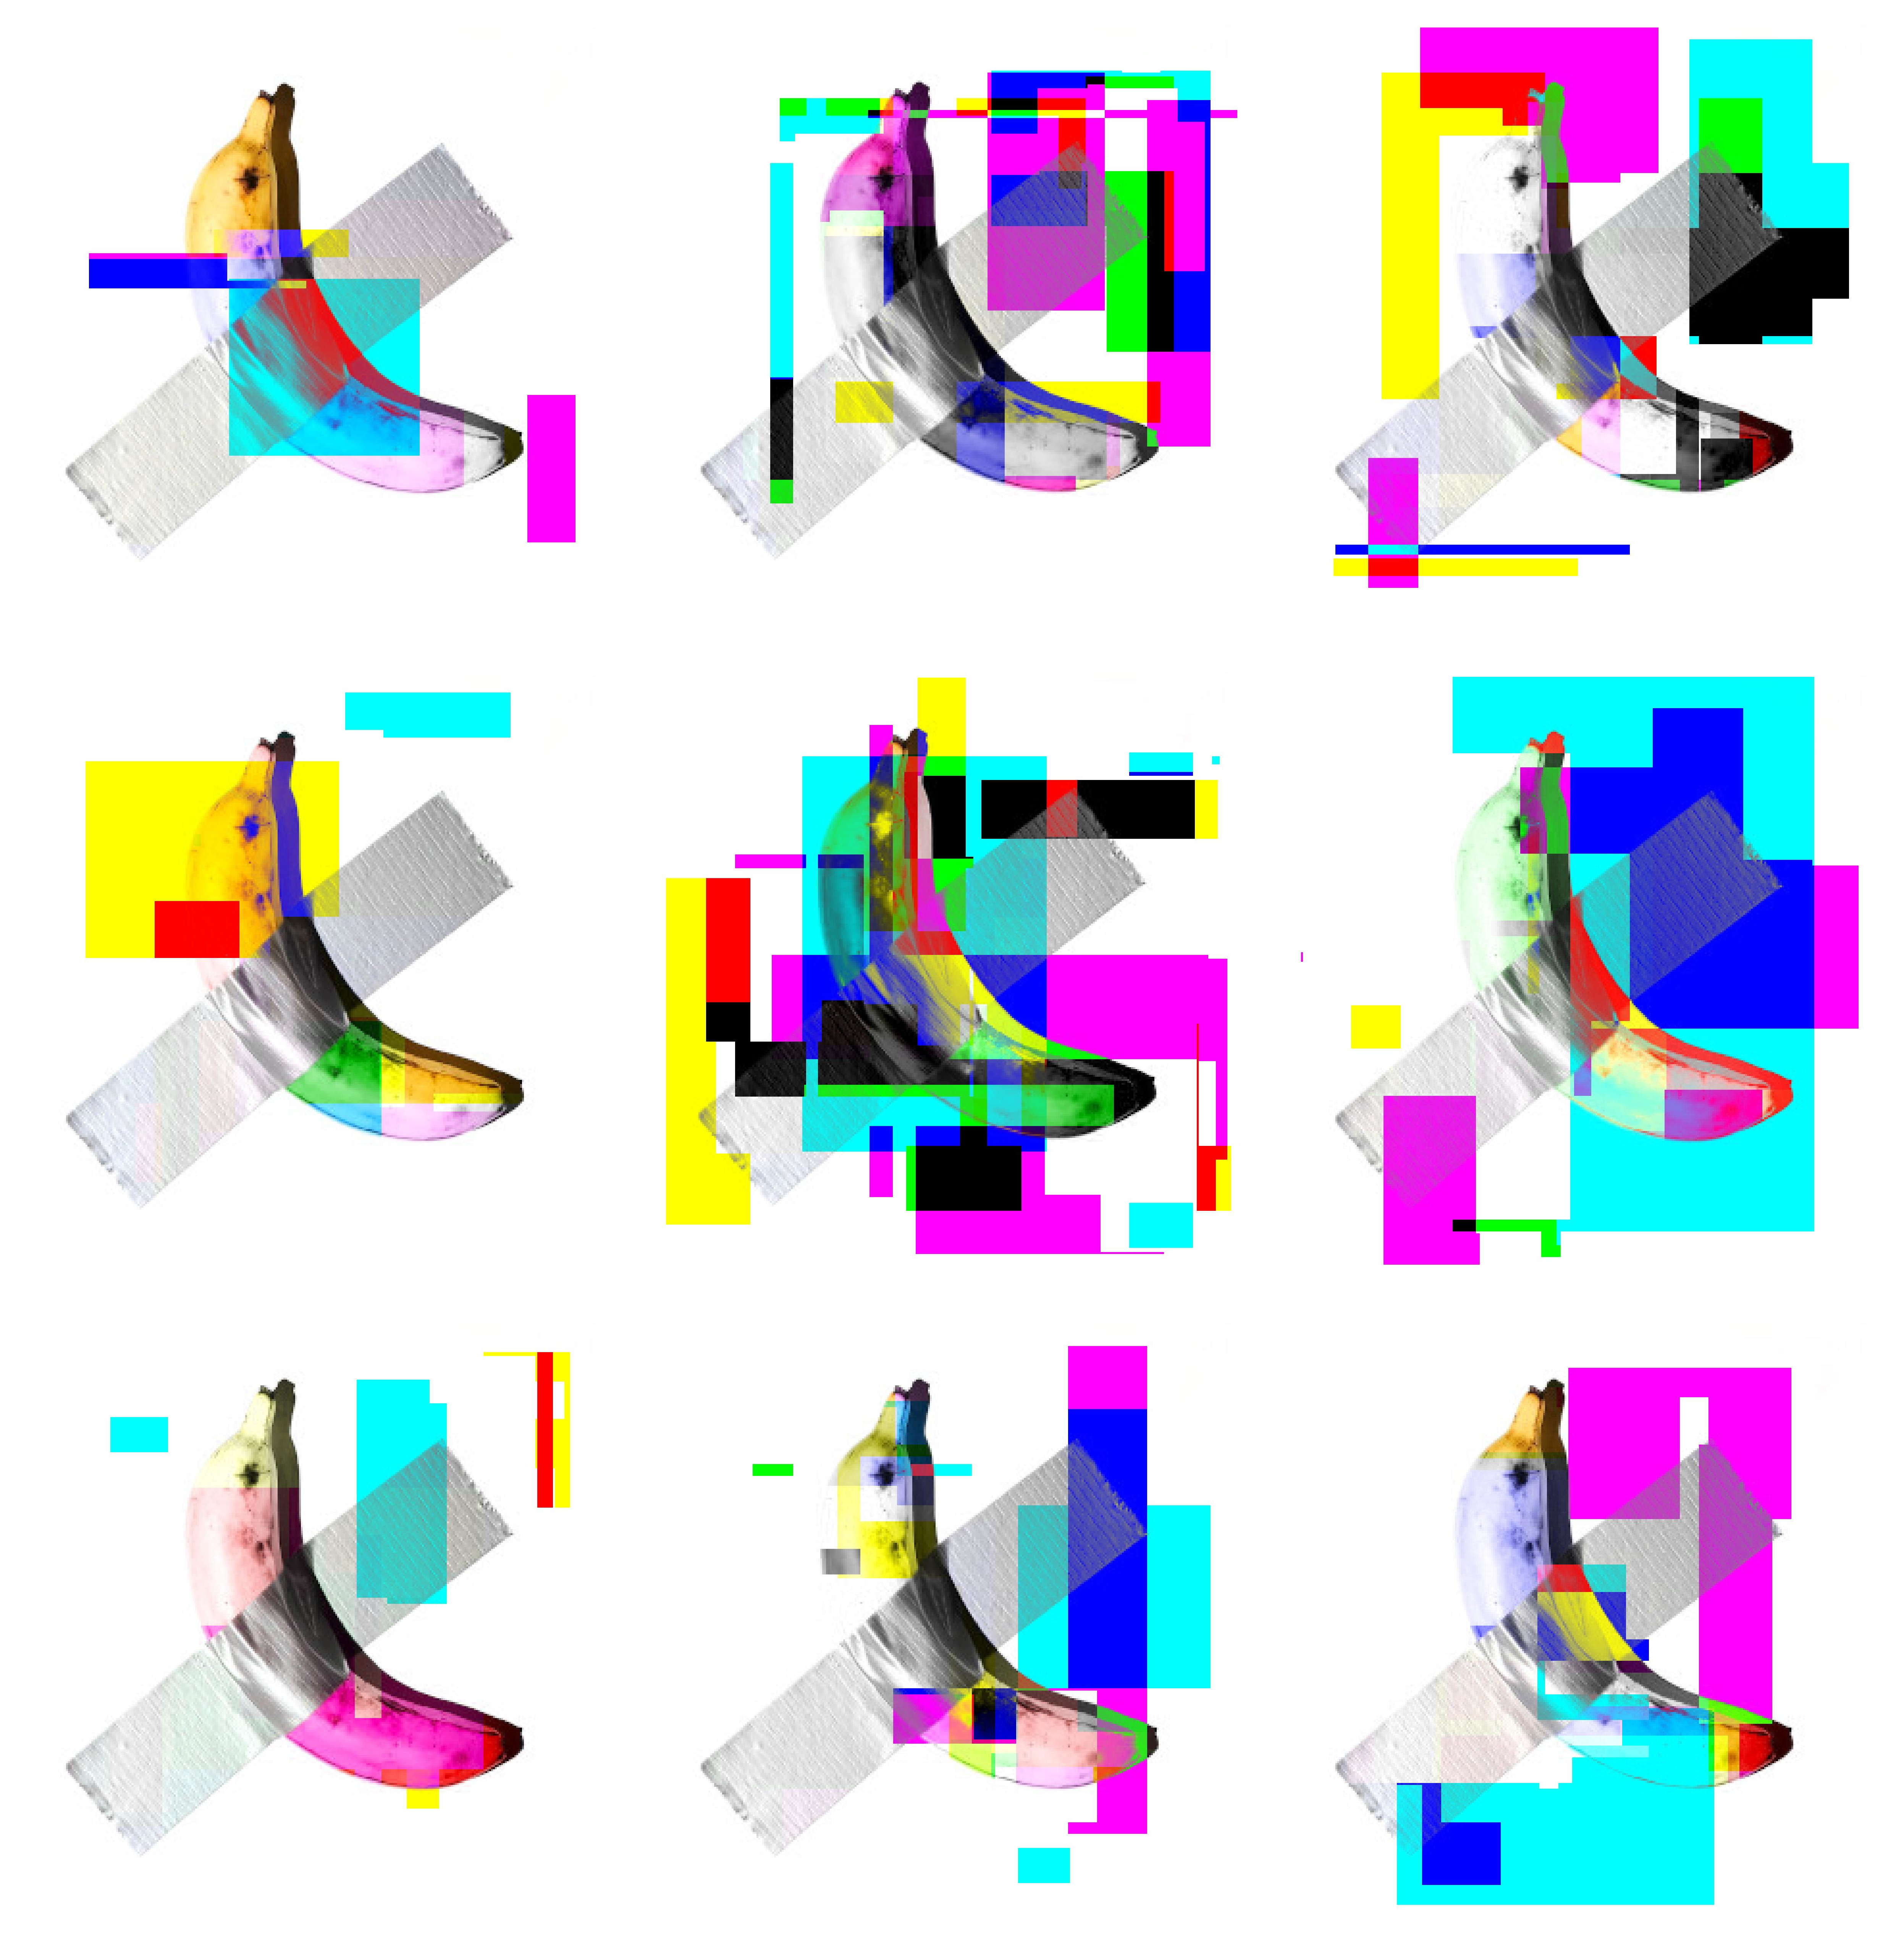
- For initial CYMK plots (Cyan, Yellow, Magenta), Stabilos are practical for learning and easily available
- Lead and color pencils are very difficult to use as they require more pressure and wear down fast
- Two passes when printing can lead to better results (for example, with less reliable pens)
Paper selection
- Generally, all paper works. Cheap paper sometimes looks cheap.
- Cheap paper tends to tear more easily with multiple passes trough one point.
- Flatter paper is more reliable with all pens (like printer paper)
- More expensive paper has a nicer texture, but tends to wear out certain pens more quickly.
- It doesn’t need to be paper, experiment around, why not try glass, wood or something else (but maybe test first on paper)
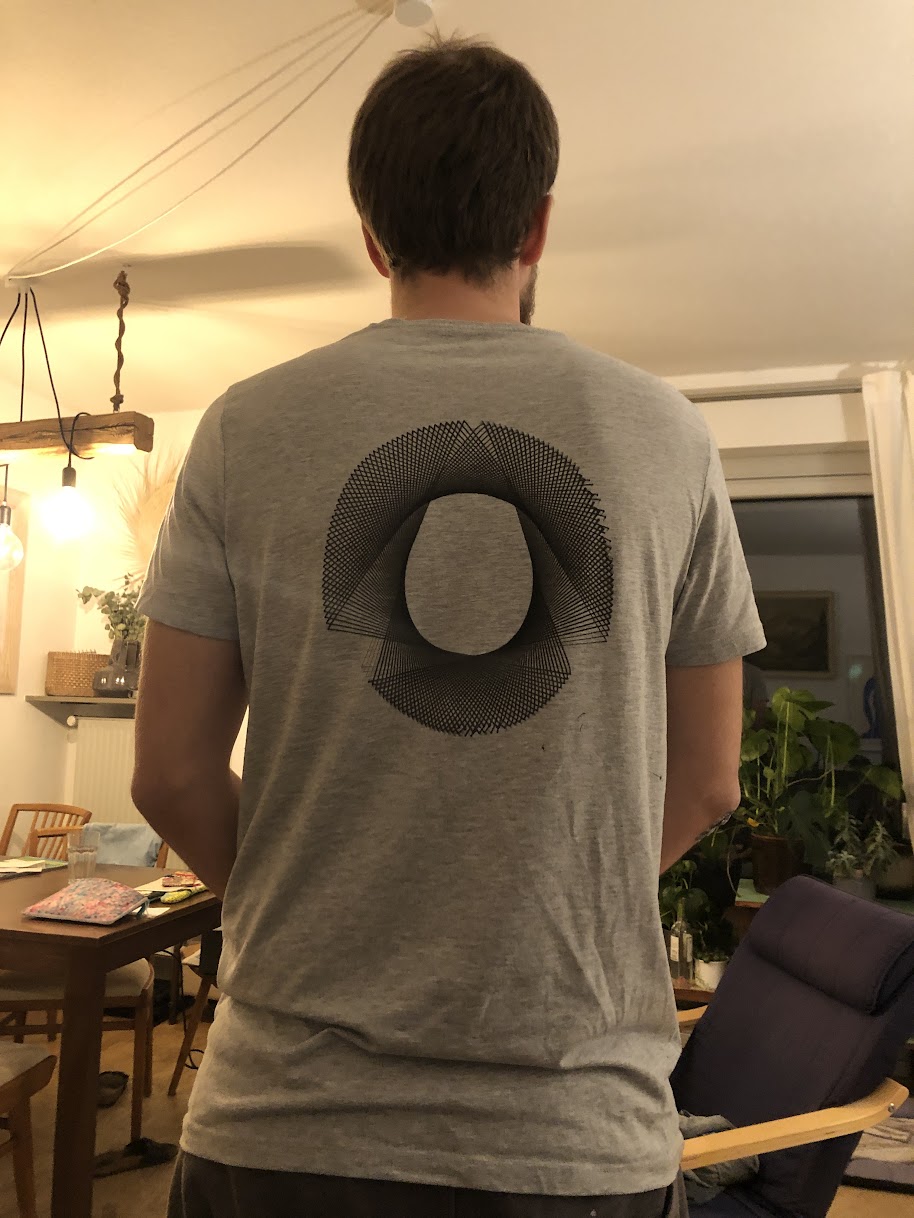
- Printing on fabric is possible, but not easy; it is important to keep the fabric taut for even printing. Detail is limited.
How to work with Inkscape (AxiDraw)
- Through the AxiDraw plugin, the Inkscape becomes an interface for controlling the pen plotter. To start printing in the menu: Extension → Axidraw Control → Apply.
- Only the lines and groups that are currently visible will be printed (important for using different pens).
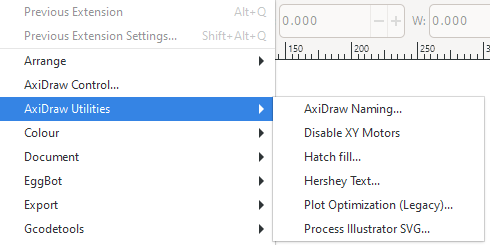
- Optimizing line order leads to faster prints (then pen moves to a close line): Axidraw Utilities → Plot Optimization. Can be activated by default.
Axidraw plugin functions for Inkscape
- Hershey Text. Better letters for plots. If you use normal fonts, it just draws the outline of the letters (which sometimes works well enough). With Hershey-text, letters are drawn with only one line (not the outline of the letters).
- Hatching: Plot can only draw lines, not surfaces, but with hatching, you can fill surfaces with lines.
- Plot Duration Estimation: Axidraw Control → Options → Preview → Enable offline Preview mode → Start normal printing
Useful links and resources
- How to draw Generative Art with AxiDraw – Great tutorial on how to set up and what to keep in mind.
- Axidraw + Processing – This tutorial is addressed to people who have basic knowledge of the Processing environment and who are familiar with structures like variables, functions and loops.
- Awesome plotters – A curated list of code and resources for computer-controlled drawing machines and other visual art robots.
- Axidraw Userguide – To official guide from Axidraw