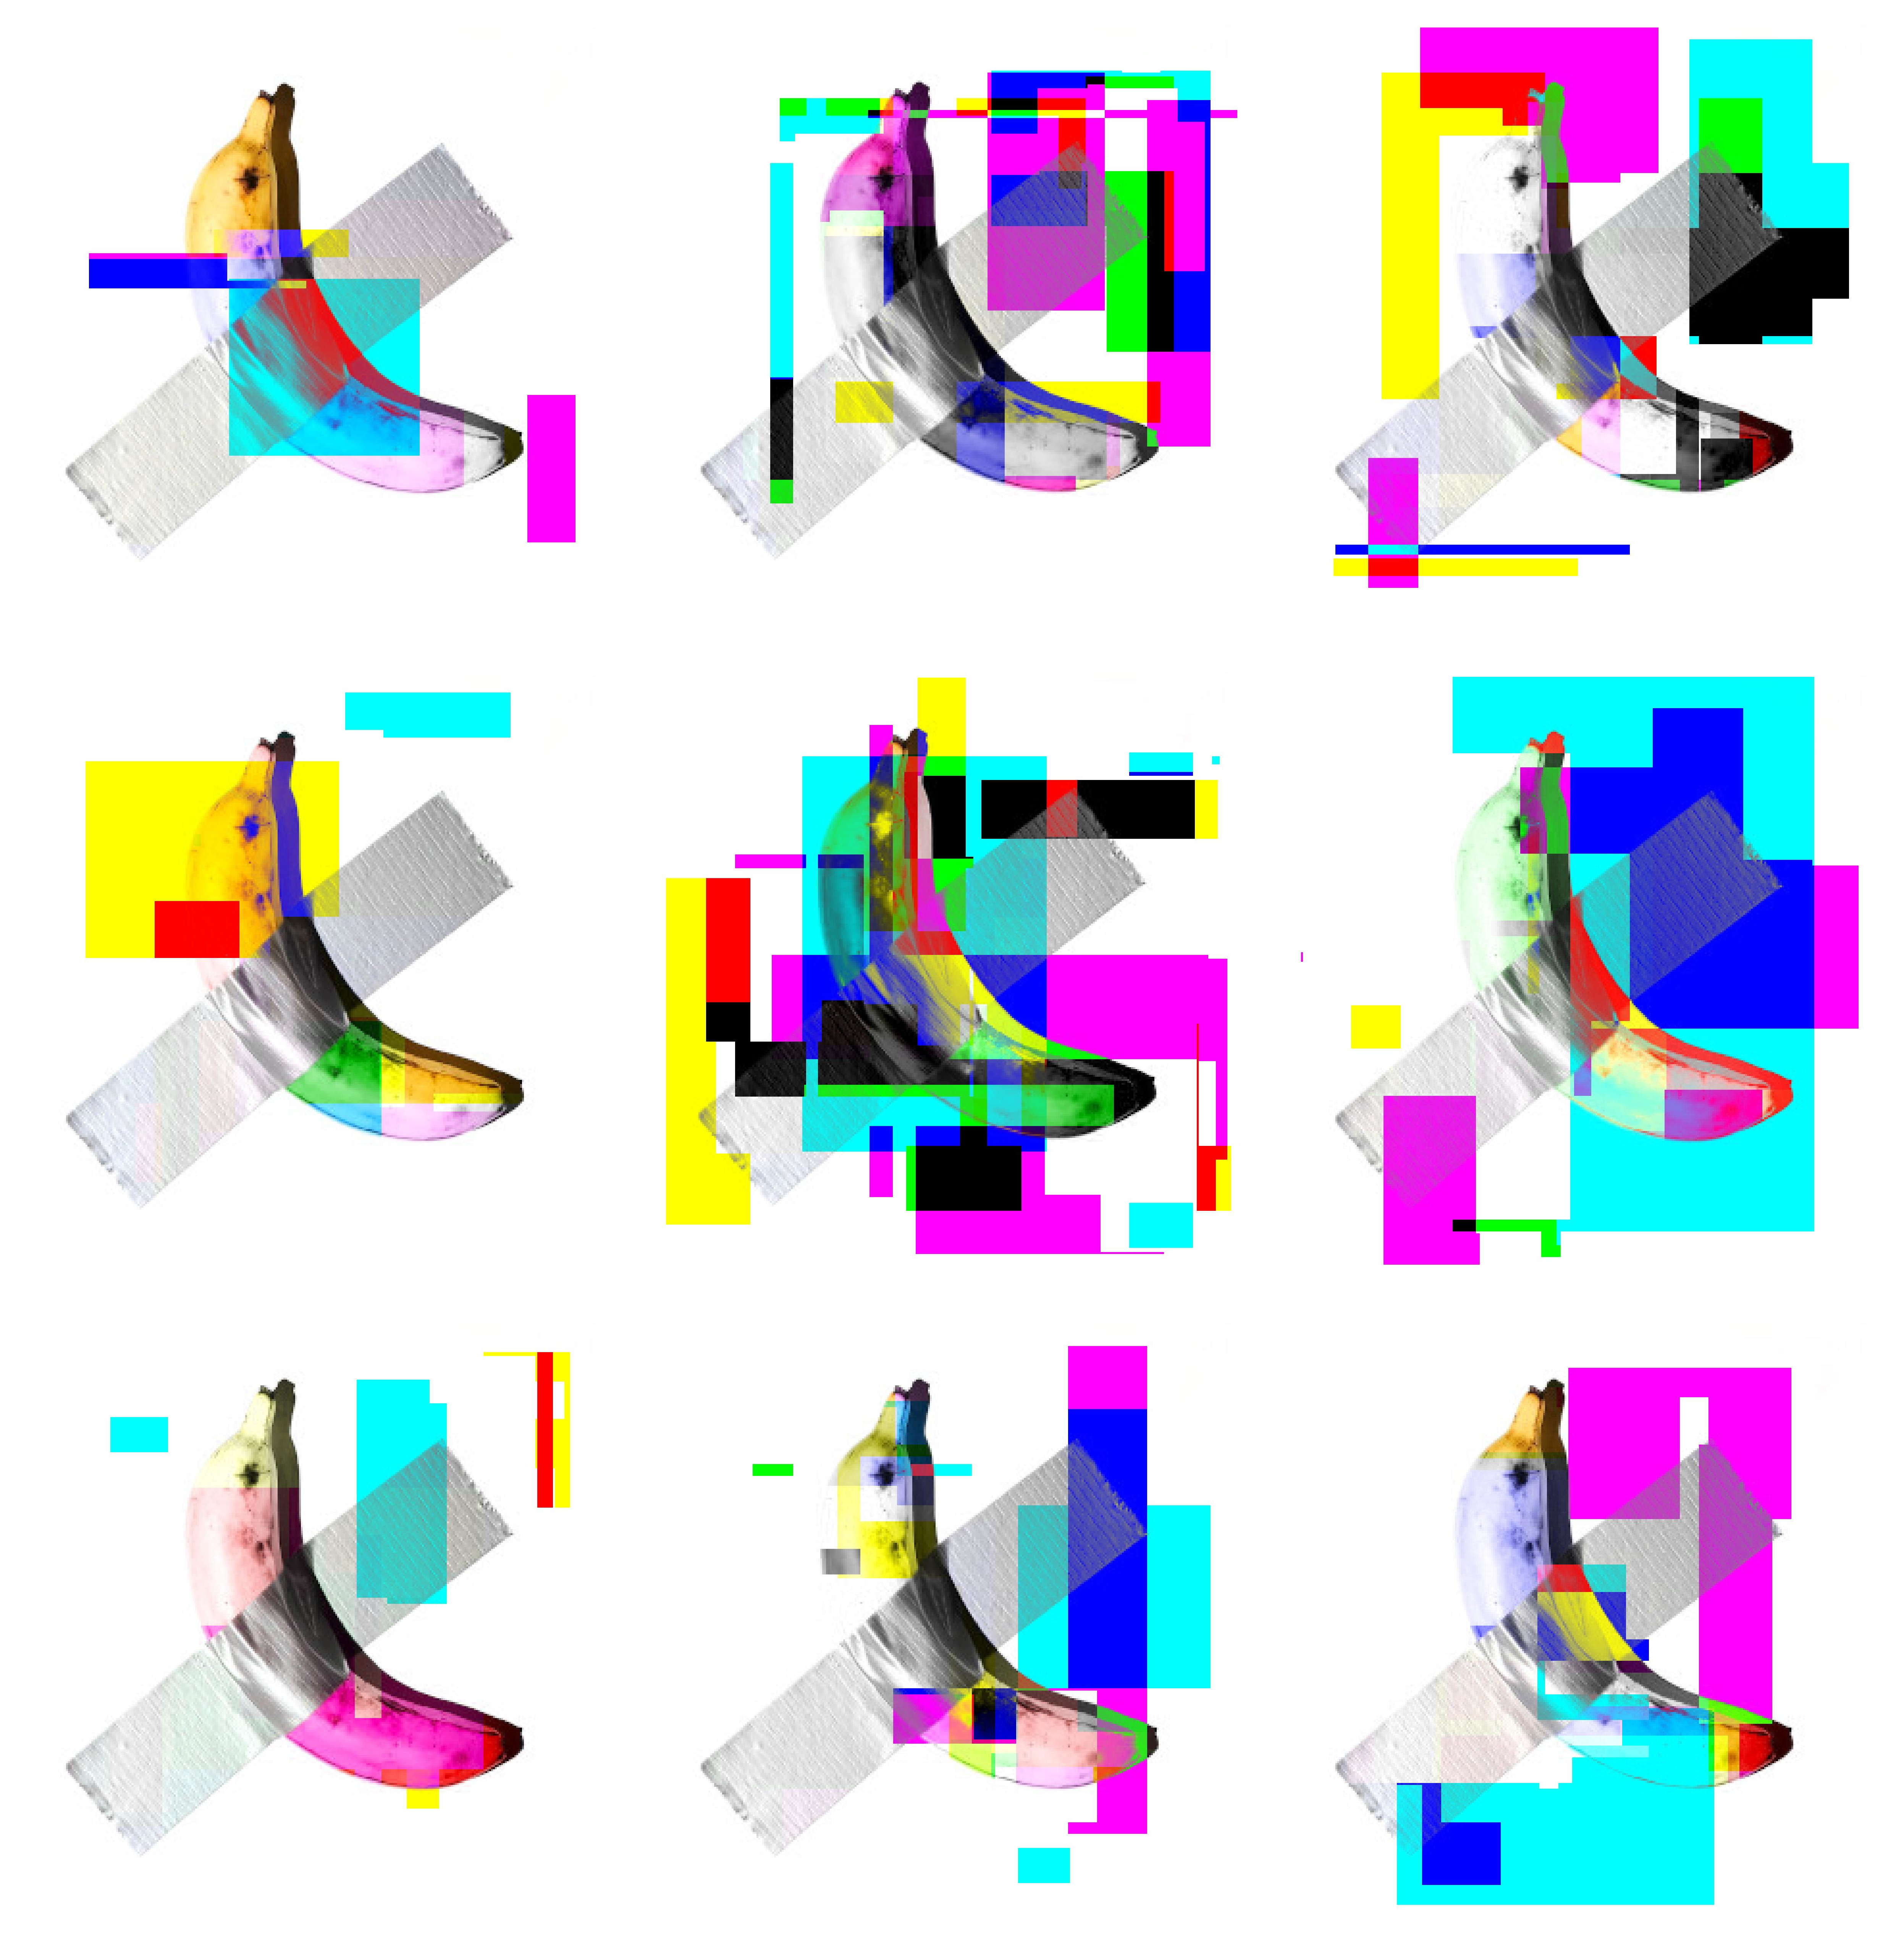
This newest project doesn’t have much to do with data visualization, but I use R for it. I am into Glitch Art quite some time already. So far, I used apps or plugins to create my own. BUT this will change now.
I was interested if I could write anything like this on my own. R is probably far from the optimal tool to work on images, but it is the only programming language I really know, so it must do. The blog Fronkostin did something with images in R recently and inspired me to try it too.
Here is my first try: I basically, selected a random square of the image and randomly shuffled to color channels around (RGB) or inverted them. And then I repeated the progress between 10 and 80 times. It is quite basic, but I love the look of it. And I just love that I can churn them out automatically, randomly creating an infinite amount of variants. The whole thing is quite slow and is basically unusable with bigger images, but it is a start.
Code
library(imager)
library(tidyverse)

setwd("path")

#convert image to dataframe. Add additional colorchannels, which will be changed.
img=as.data.frame(image,wide="c")%>%rename(red1=c.1,green1=c.2,blue1=c.3)%>%
mutate(red=red1, blue=blue1, green=green1)

 #this function randomly changes colorchannels of random squares. also uses negative of the colorchannel


colorswitches = function(data,negative=T){

#create cordinates for squares. choose randomly two points on the x and y axis.
liney=sample(1:max(data$y),2)%>%sort()
linex=sample(1:max(data$x),2)%>%sort()

#there are 6 color variables. three of them are the originals. three of them are the ones who are changed
#variable which defines where color is picked from. chooses from orignal and changable variables. it is important that it also picks from original from time to time. because else at one point all becomes grey.
fromcolor=sample(3:8,1)
#randomly selects one of 3 changable variables
tocolor=sample(6:8,1)

#add 1 to 6 chance the negative of the color is used.
minuscolor=ifelse (sample(1:6,1)==1,T,F)

#this is just that the for counter doesn't has to start at one. small speedup
startbla=max(data$x)*(liney[1]-2)
startbla=ifelse(startbla<1,1,startbla)

for(i in startbla:nrow(data)){

#check if x and y is inside the defined square
if (data$y[i] > liney[1]){
if(data$x[i]<linex[2] & data$x[i]>linex[1]){

#two version of changing the color value of the selected channel. one negative on normal.
if(minuscolor==T &negative==T) data[i,tocolor]=1-data[i,fromcolor]
else data[i,tocolor]=data[i,fromcolor]
}
}
#if y bigger then selected square, stop loop
if(data$y[i]>liney[2]){
break
}
}
data
}


#repeating the colorsquare function
for(i in 1:50){
img=colorswitches(img)
}


#create proper RGB code from the three color channels
img=img%>% mutate(rgb=rgb(red,green,blue))

#display it with ggplot.
p<- ggplot(img,aes(x,y))+geom_raster(aes(fill=rgb))+scale_fill_identity()+
scale_y_reverse()+
theme_void()
p
