In 2014 Switzerland had a referendum about the initiative “against mass immigration”. I passed with 50.33 percent to the surprise of most people. The result caused a turmoil in Swiss politics. The goal of the initiative was to introduce upper limits for immigration. This seemed to contradict the Schengen-agreement with the European Union. Implementing it would probably mean the end of free movement and risk the Bilateral treaties with the EU, which are an important pillar of the economic success of Switzerland.
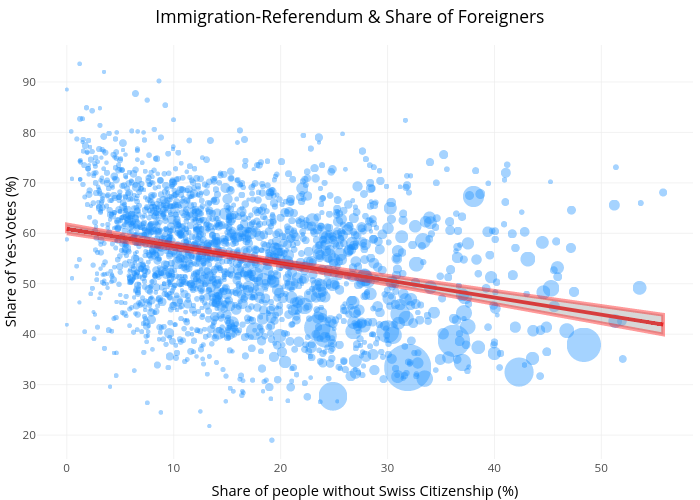
One of the discussions after the referendum was, if places with more foreigners are more or less likely to vote for the referendum. On occasion of the Swiss People Party launching a new referendum to cancel the “Free Movement”-treaty, I wanted to revisit the vote of the 9. February 2014 and look at the data.
 R-Squared: 0.1318
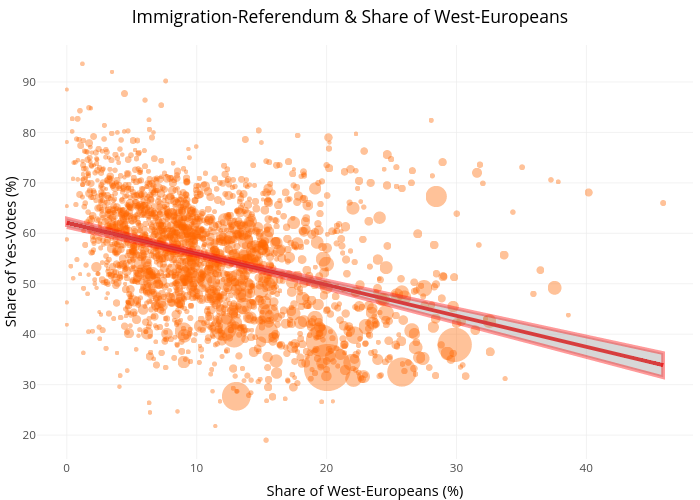
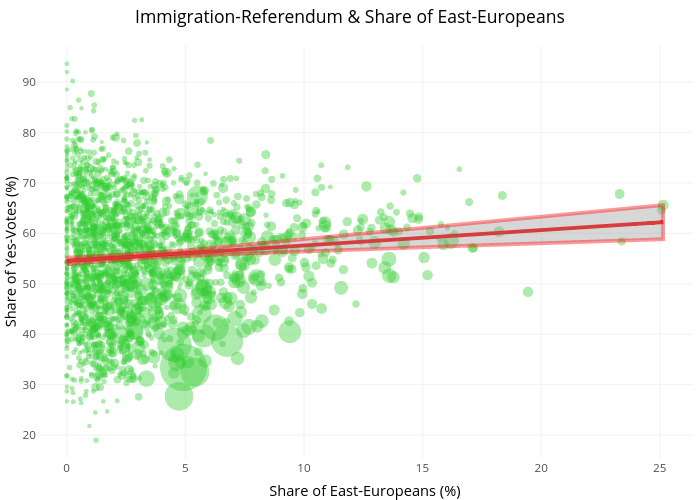 R-Squared: 0.006838
 R-Squared: 0.08507
About the Data
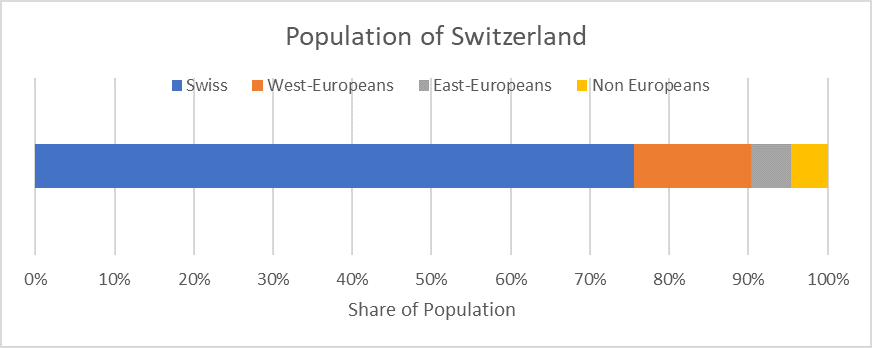
I got the data from the Federal Statistical Office of Switzerland. I used the referendum-results and the number foreigners on the municipal-level. The voting districts and municipal borders didn’t align everywhere, so I had to drop a few, which left me with 2126 observations. I categorized the countries into three regions: Western Europa (including Greece), Eastern Europe (including Russia, but not Turkey) and the rest of the world.
Just doing a simple OLS-regression to check if the charts just looks nice or also means anything, it doesn’t look too bad. The R-Squared looks terrible separately, together tough there might be some explanation-value.
Call:
lm(formula = Yes ~ East + West + Non_Europeans, data = alledaten)

Residuals:
    Min      1Q  Median      3Q     Max
-32.744  -6.659  -0.395   6.257  34.572

Coefficients:
              Estimate Std. Error t value Pr(>|t|)
(Intercept)   60.77451    0.42677  142.41   <2e-16 ***
East           1.16063    0.07913   14.67   <2e-16 ***
West          -0.51224    0.03722  -13.76   <2e-16 ***
Non_Europeans -1.55550    0.12424  -12.52   <2e-16 ***
---
Signif. codes:  0 ‘***’ 0.001 ‘**’ 0.01 ‘*’ 0.05 ‘.’ 0.1 ‘ ’ 1

Residual standard error: 10.03 on 2122 degrees of freedom
Multiple R-squared:  0.2268,  Adjusted R-squared:  0.2257
F-statistic: 207.5 on 3 and 2122 DF,  p-value: < 2.2e-16
There is some collinearity between the different variables, which should be taken into account.
cor(alledaten %>% select(East,West,Non_Europeans))

              East      West      Non_Europeans
East          1.0000000 0.2796868 0.5050523
West          0.2796868 1.0000000 0.4944347
Non_Europeans 0.5050523 0.4944347 1.0000000