Categories
AI art Art Generative Art HowTo Pen plotting Tutorial

How to use generative AI to create pen plots

Do you love AI-Art? Do you love Penplotting? You just don’t know how to combine them using the strengths of both tools?! Well, have no fear because I am here to show you a technique that will bring your AI-generated art to the physical world with the help of a pen plotter.

The key to this technique is using AI to generate images in a coloring book style, which is useful, when you use a printer that just draws lines.

To follow this guide, you’ll need:

  • Access to an AI which can generate images. Midjourney, Stable Diffusion or Dalle will work. (I personally prefer Midjourney because it gives the best and most visually pleasing results, but you do you)
  • Photo Editing software, such as Gimp or Photoshop (because let’s face it, no AI is perfect – yet)
  • Inkscape with the Axidraw Extension (because, plotter)

There is no coding needed for this technique.

Generate image with AI

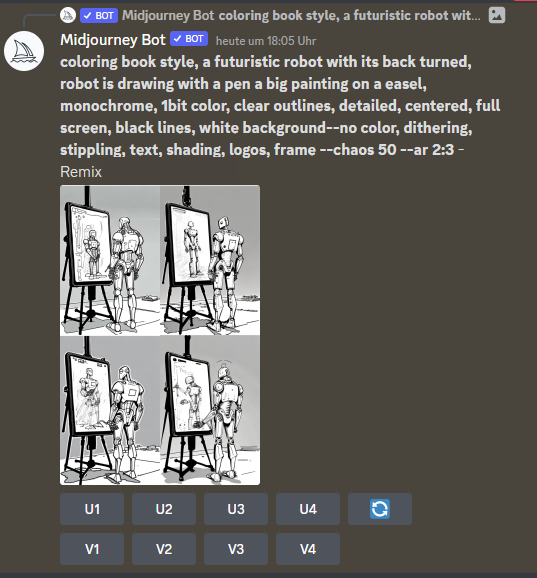
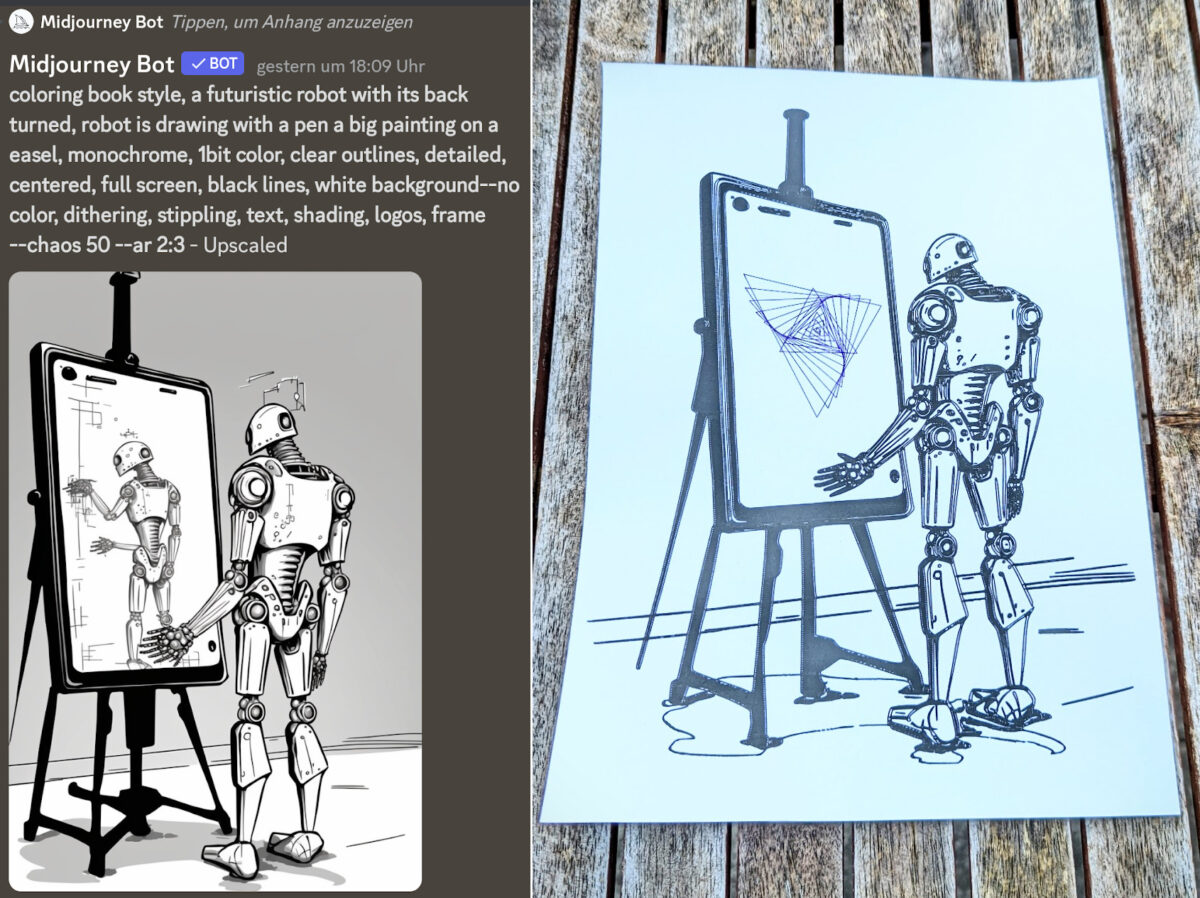
Useful terms (midjourney):

coloring book style, <description>, monochrome, 1bit color, clear outlines, detailed, centred, full screen, high contrast, black lines, white background

Negatives: color, dithering, stippling, text, shading, logos, frame

Ideally, you want an image which is just black and white, with no grey color in between (1bit).

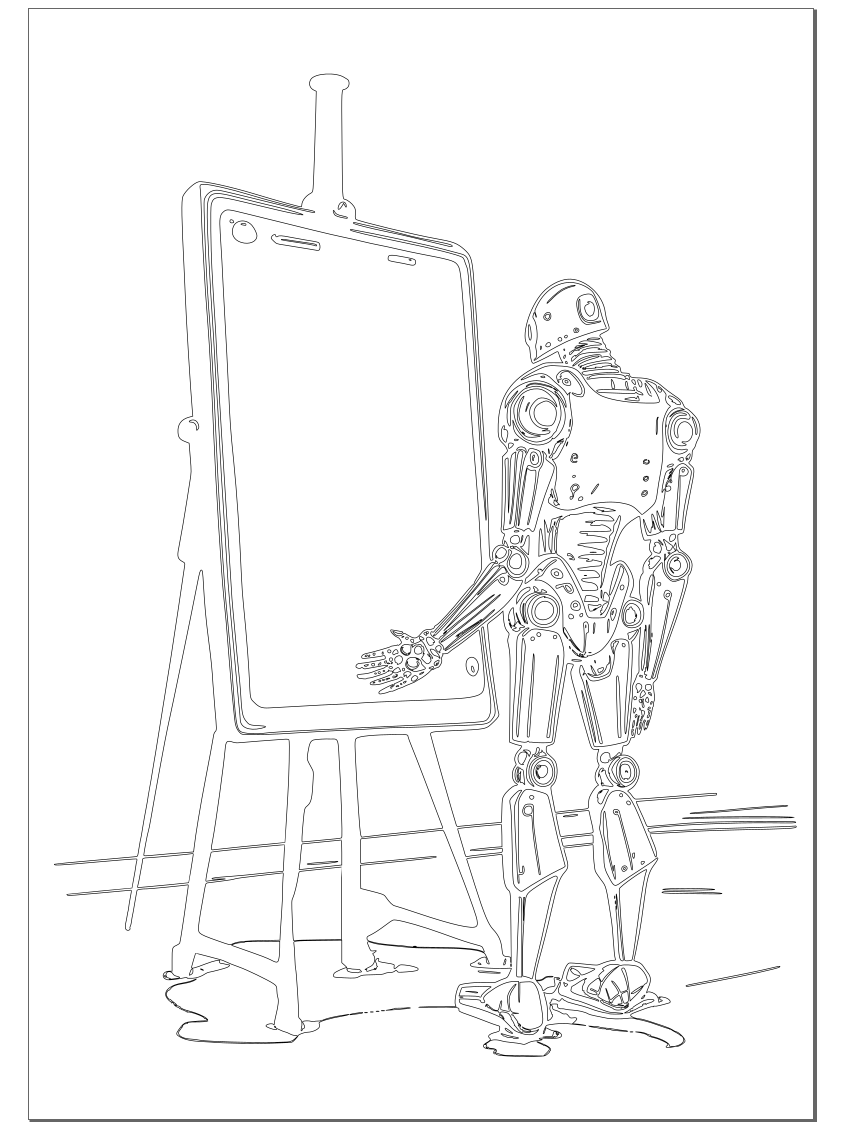
Fix the image, raise contrast

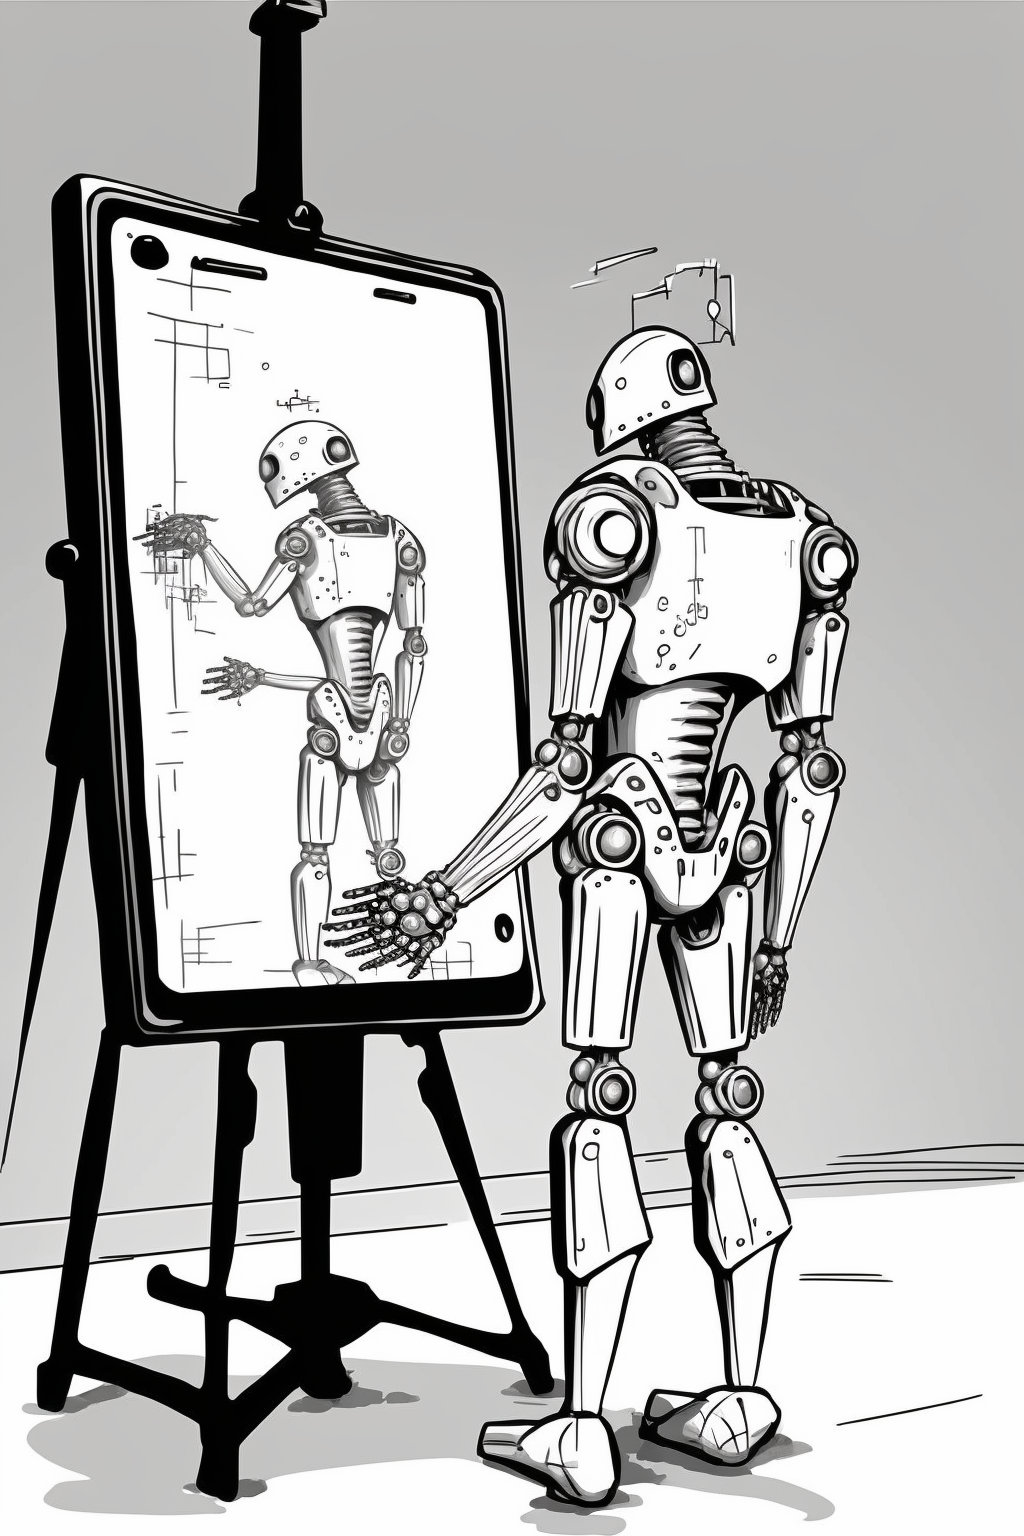
The next step in our process is editing the image. It can be a bit of a pain, but trust me, it’s worth it in the end. The goal here is to clean up any mistakes the AI made and crank up the contrast, so we’re left with a sleek black and white image.

Now, when it comes to increasing contrast, just cranking up that contrast slider isn’t going to cut it. You’ll lose some of the finer details that way. My personal go-to method is a combination of working with the contrast curve, sharpening tools, and a bit of manual repainting. Some manual tweaking is necessary, lines disappear due to being too light or thin.

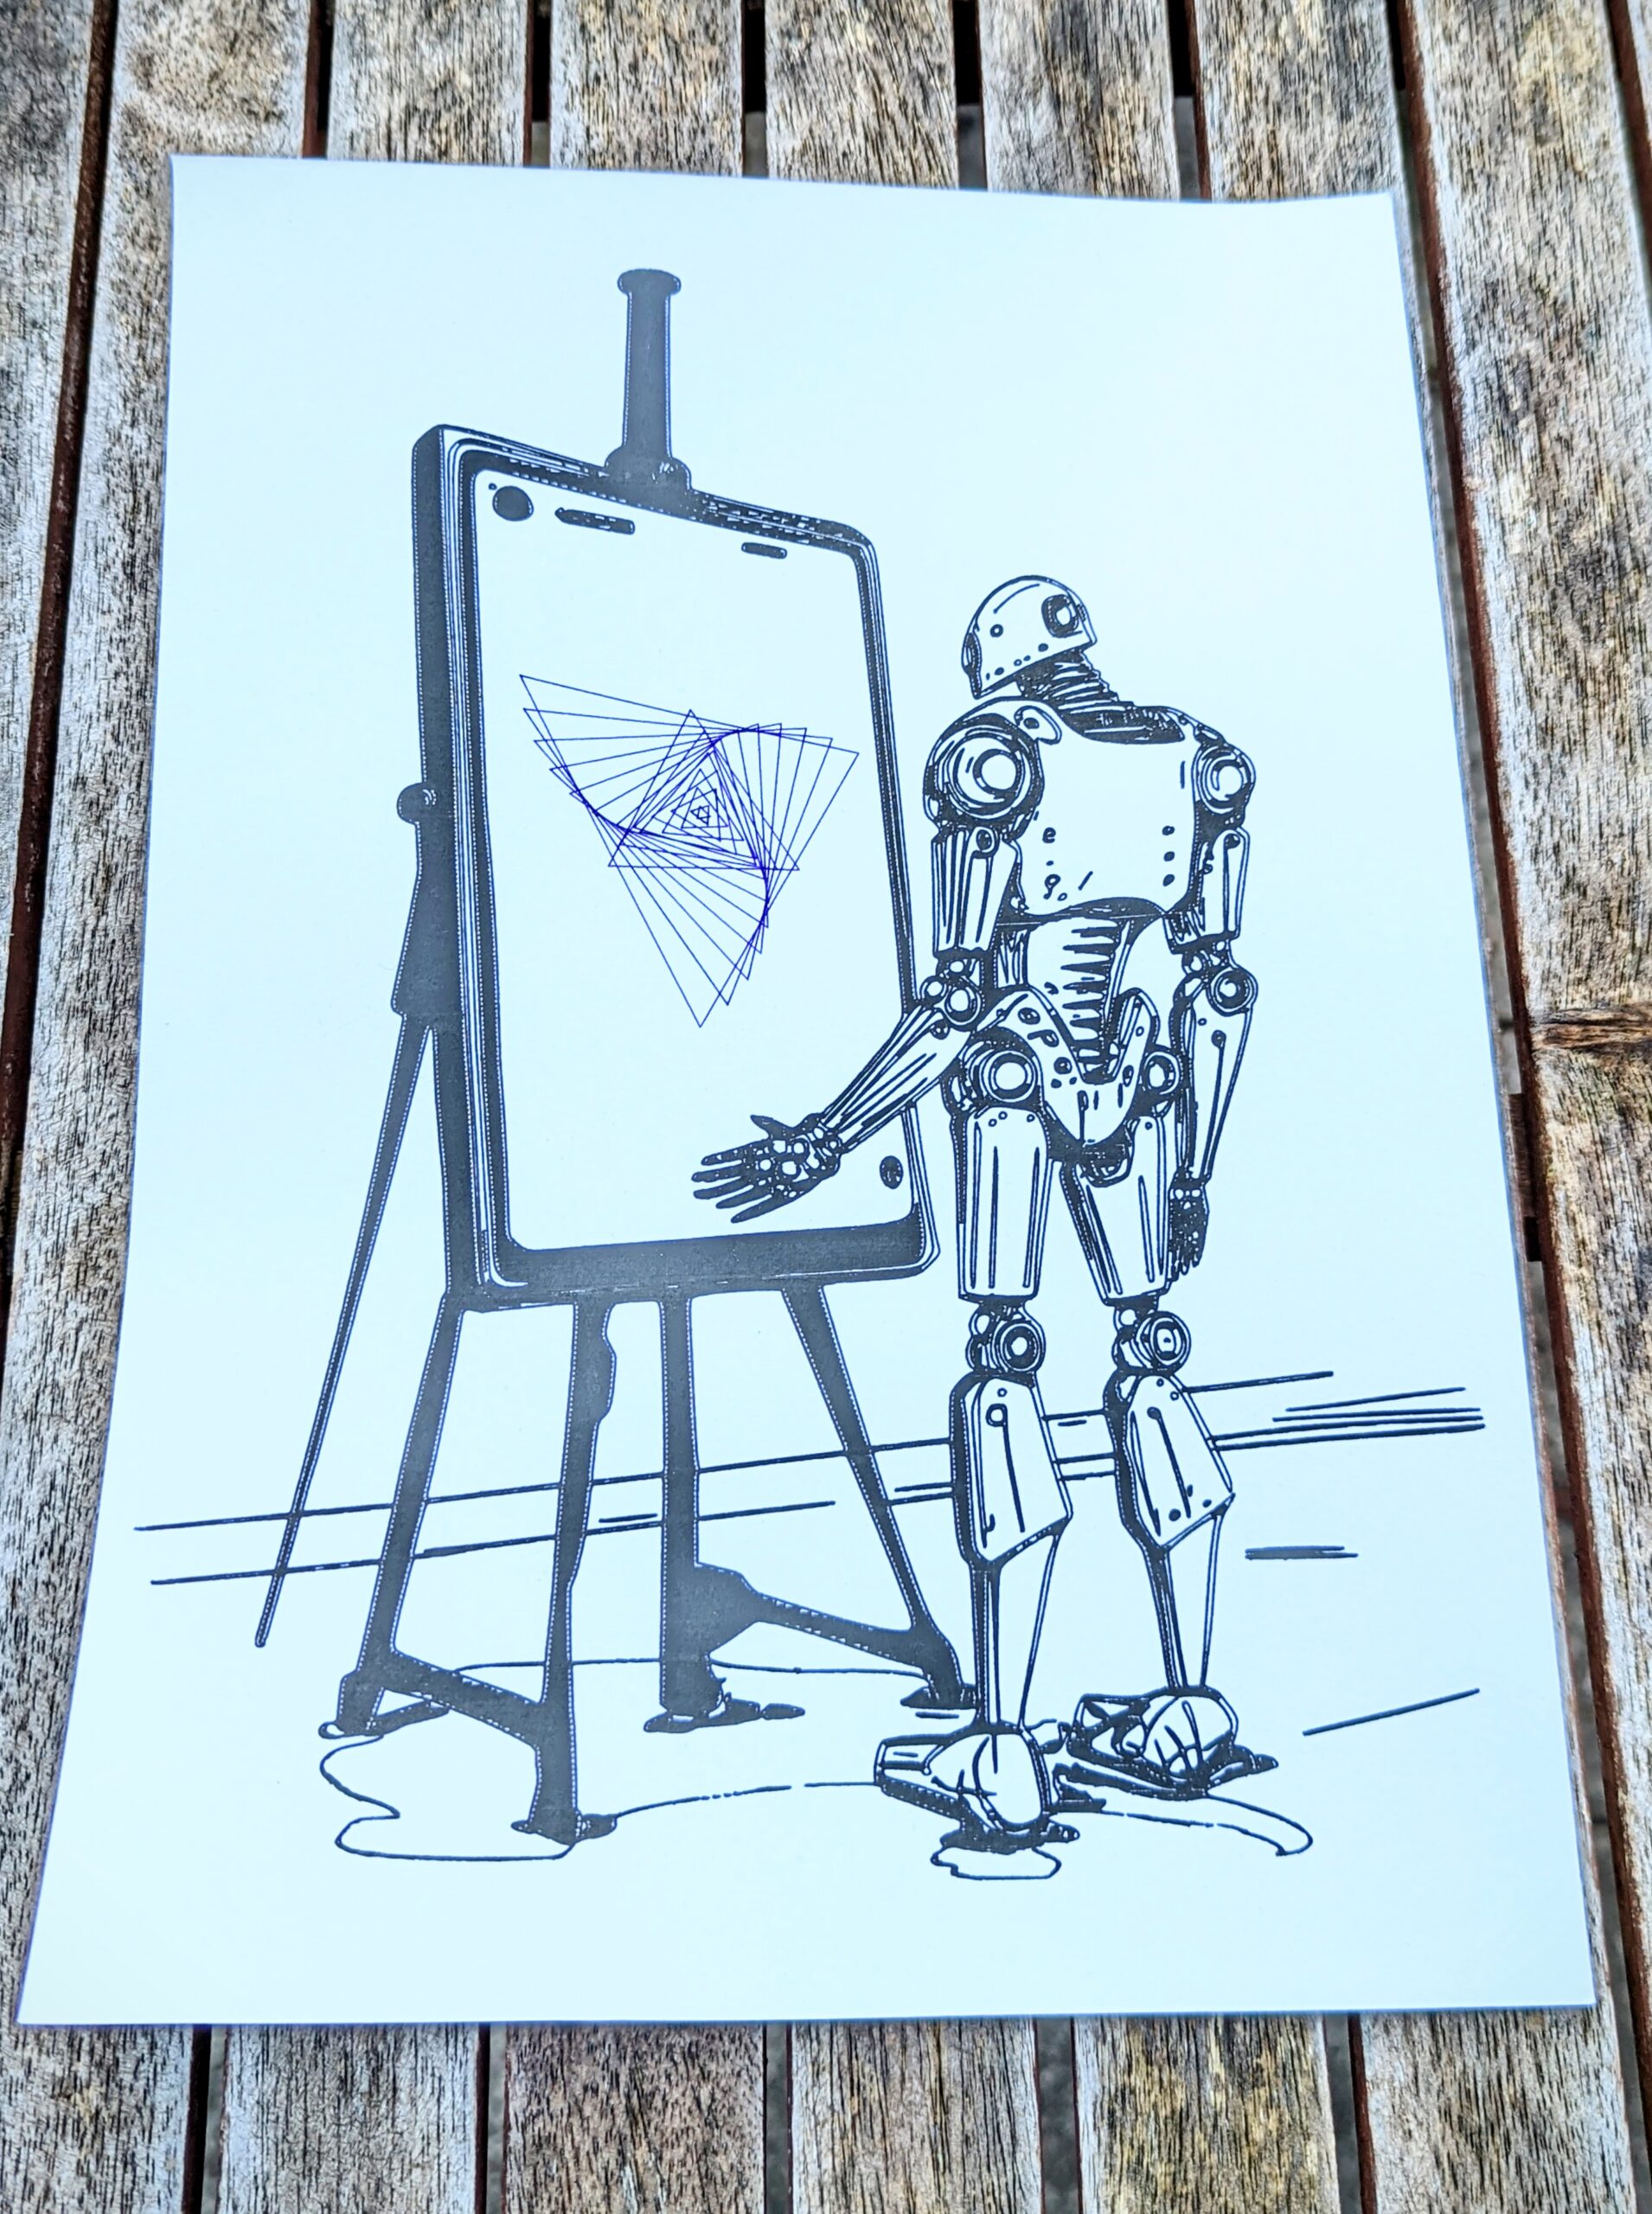
In this example, I made a few notable changes, like:

  • Removing the content within the frame
  • Attempting to recreate the easel without altering the geometry
  • Removing some fingers on the hand
  • Removing AI-generated artefacts.

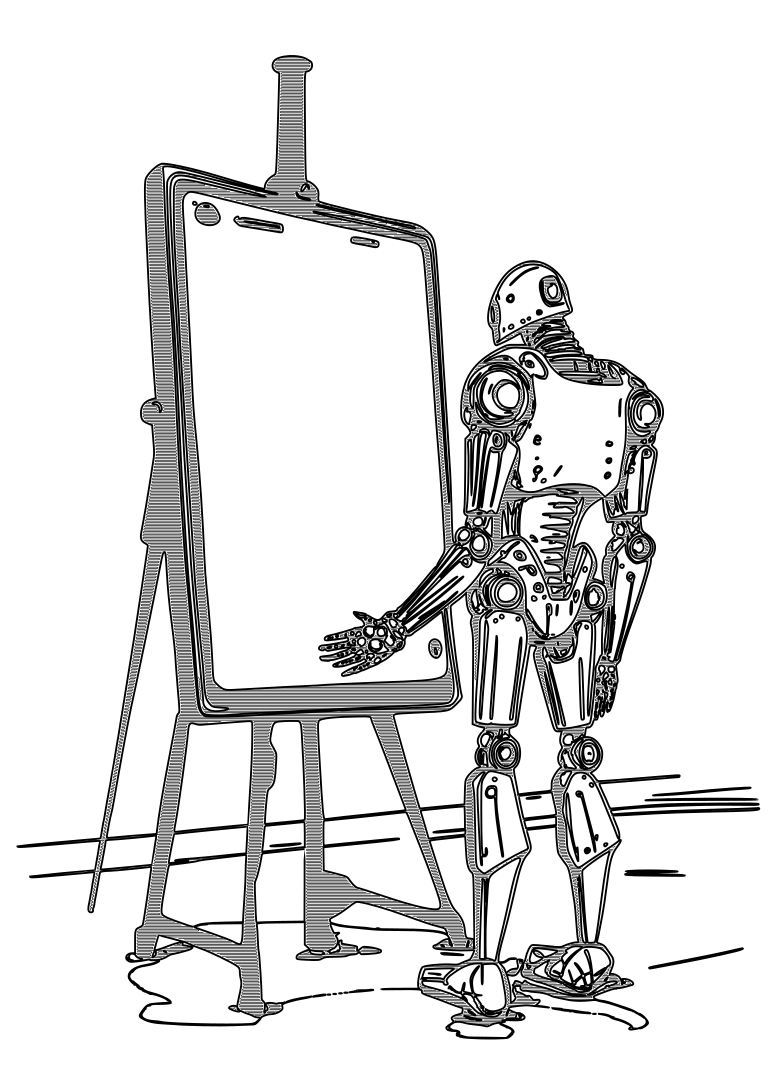
Convert image to a vector file

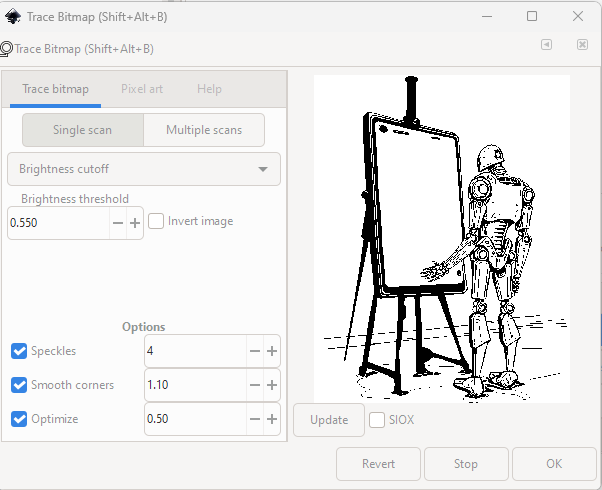
As a next step, open the fixed image in Inkscape.

Make sure you have the image selected in the objects menu and then select “Path” –> “Trace Bitmap”.

A window should open like in the image above (first without a preview). For me, “Single scan” –> “Brightness cutoff” worked best so far, but feel free to experiment. Same of the options values at the bottom. Click “Update”

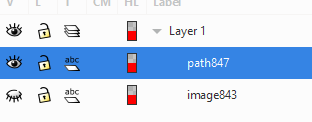
When you are happy with the result, click “OK”. In the next step, deactivate the image object by clicking on the eye and select the newly created path.

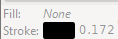
In the bottom left corner of the Inkscape window, change the fill-color to “none” and stroke-color to some visible color.

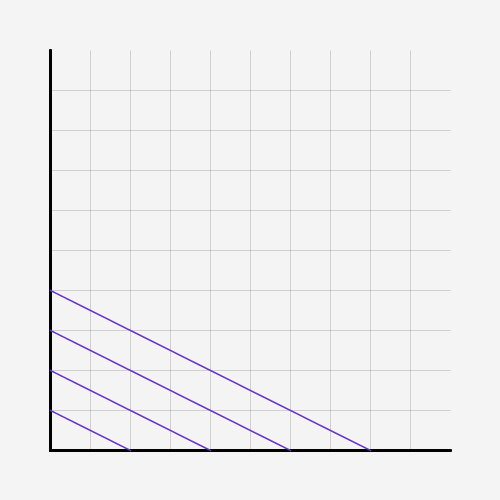
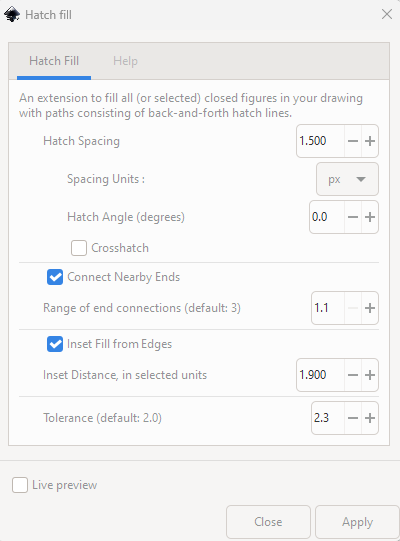
Hatch the empty spaces

To fill the empty spaces, select Extensions –> Axi Draw Utilities –> Hatch Fill. Settings depend on size of paper and pen used.

I used these settings for A4 with 0.8 pen, which worked quite well. But I would make the inset distance a bit smaller, there were sometimes gaps between the outline and the hatching.

Plot it

And that’s about it! The only thing left to do is to plot your masterpiece (beautiful, award-winning, by Greg Rutkowski).

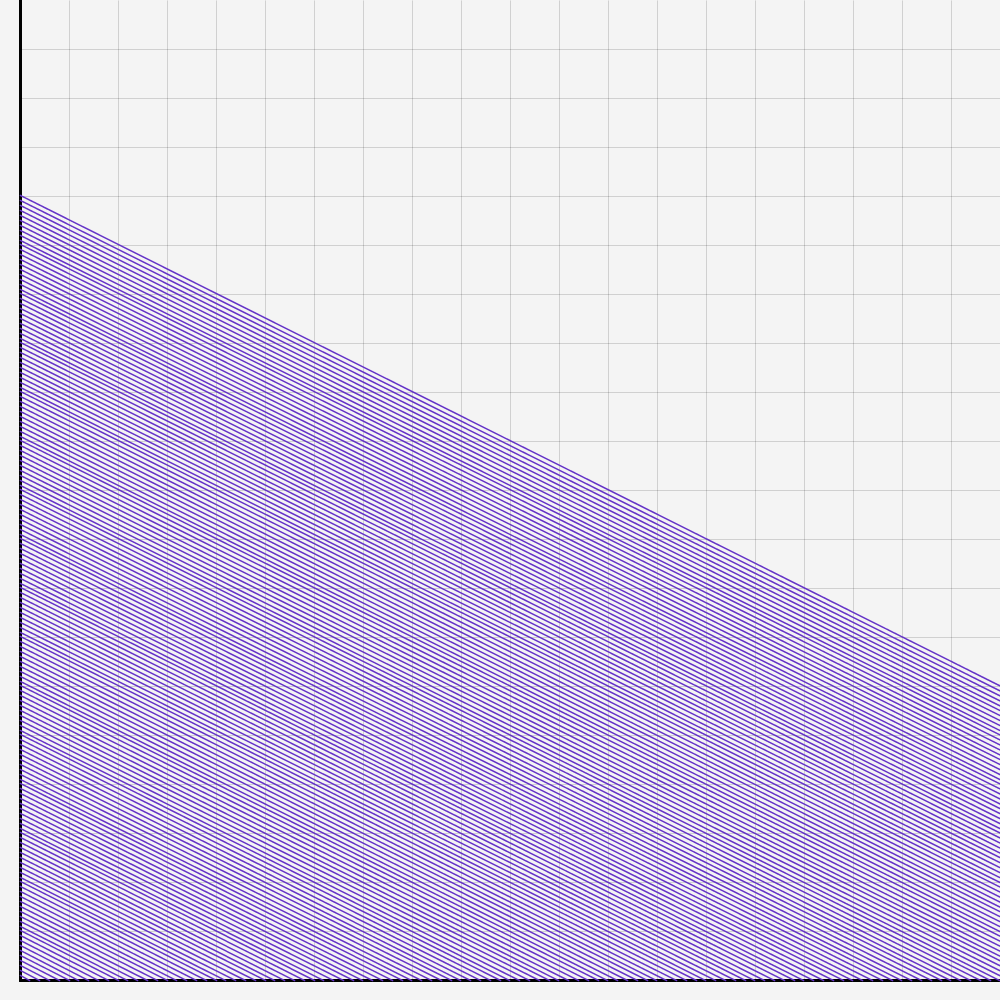
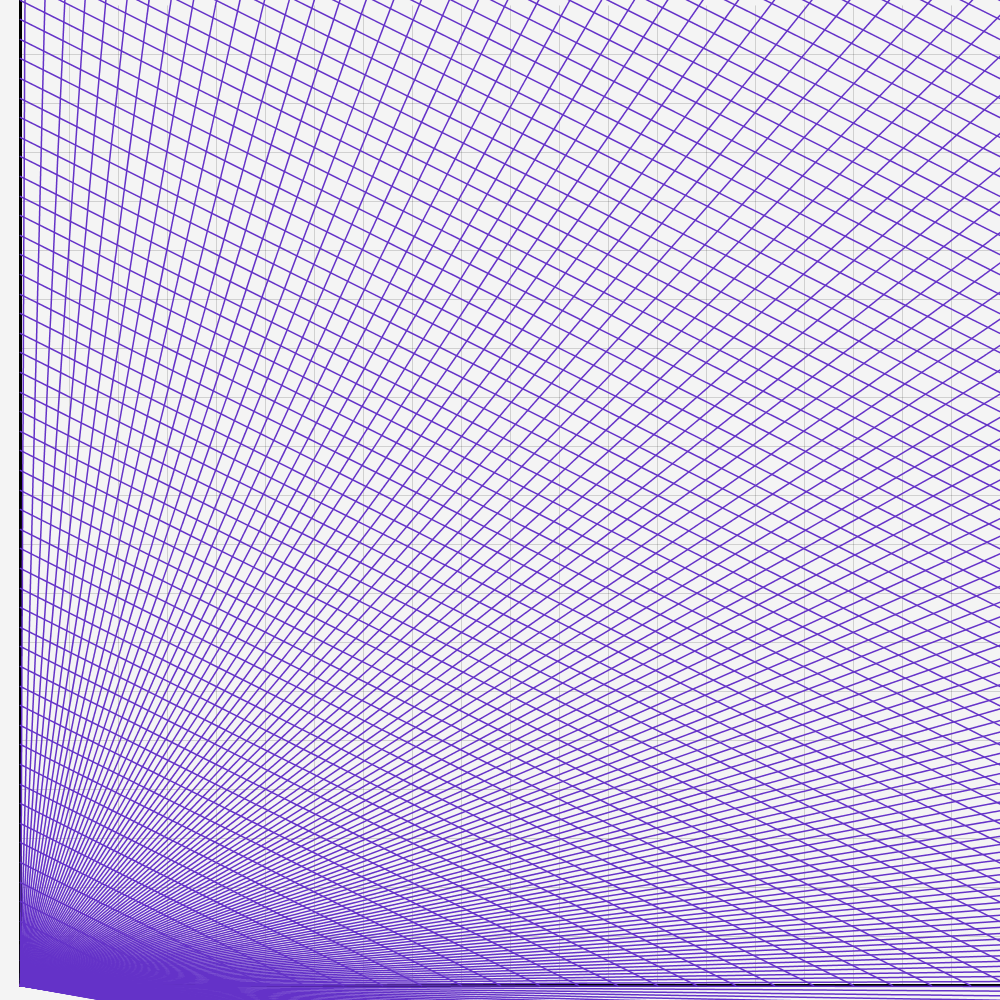
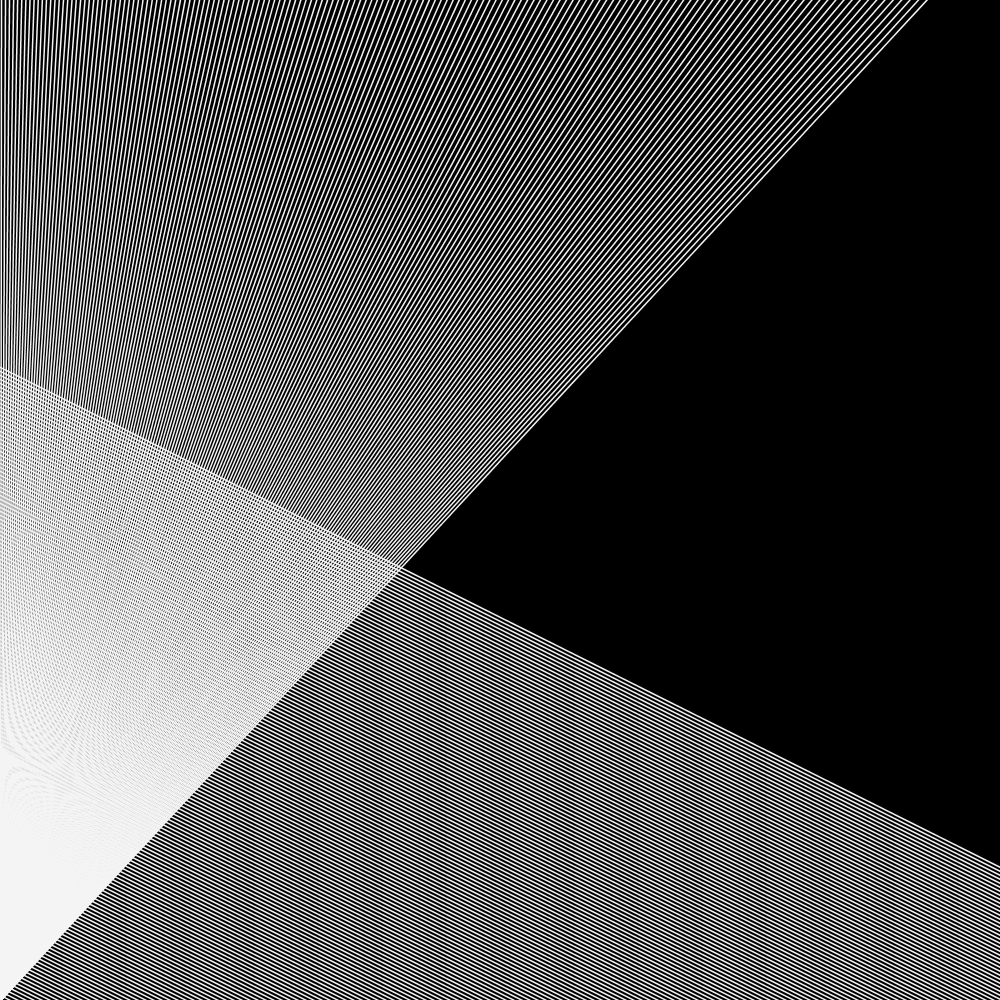
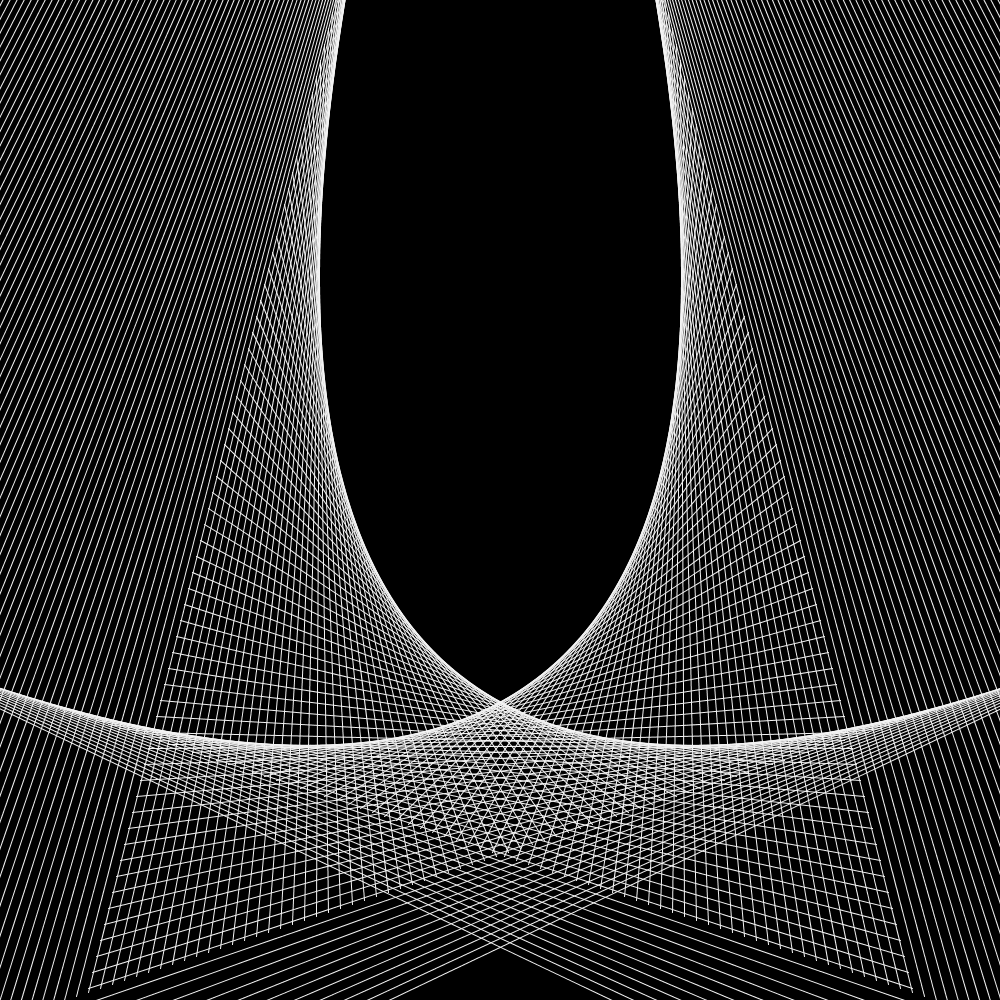
As a little bonus, I added generative art on mine.

This is just the basic technique, there’s a whole world of possibilities out there to improve and build upon it. I’ve been experimenting with taking apart the images and working with different layers and colors. If you want to see some of my experiments, check out my Instagram.

Also, I wrote a tool for myself that does the vectorizing. The advantage is the hatching follows the structure of the outlines, which leads to nice results compared to just parallel hatching.

So, thanks for reading and if you want to give me some feedback, hit me up on Instagram or Mastodon.

Categories
Generative Art HowTo Tutorial

How does creating generative art work? An introduction for non-coders

This is an introduction into coding with the goal of creating generative art. There will be no actual coding in this post, just fake code based on Processing. All you need to know is some maths from school.

A lot of generative art is at its core a combination of lines and filled out shapes created by a computer. Still, it is hard to explain it to someone with no experience in programming. This introduction is my attempt at explaining how I tell the computer to draw cool images.

Every Screen is a coordinate System

You remember the coordinate system from school? It is at the core of everything when we try to draw on screens. It’s very useful.

(Wikipedia: Coordinate System)

You can use the coordinates to tell the computer where to draw stuff, like for example points -> Point(x,y)

Point(2,3)
Point(-3,1)
Point(-1.5,-2.5)

(This code isn’t a real programming language, but most would work similar like the example. First the name of a function, like “point” and then the coordinates in brackets)


With the same principle, you can tell the computer to draw lines:

Line( start_x, start_y, end_x, end_y) 

That translates to: Draw a line from Point (start_x, start_y) to Point (end_x, end_y).

Line(0,1,2,0)
Line(0,2,4,0)
Line(0,3,6,0)
Line(0,4,8,0)

Writing down coordinates isn’t taking advantage of a computer and annoying. Computers are great in adding and repeating things many times, so they should do the work.

There is a pattern in the distance of the lines. This is easy to automate with a computer. But first, you need to understand two concepts in programming: Variables and Loops.


Variables

Variables are a way for the computer to remember numbers (also text and lists, but that is not relevant here). We need them to reuse values. One basic thing we need them for is to count. And to count up you need to remember the last number you counted. Same for the computer.

Variables work similar like letters in maths. You assign a letter (or a word) a value. That letter is then equal to that value.

a=3
banana=1
c=a+banana

a is set to 3
banana is set to 1
c is set to a+banana

c is now 4.

Now we learnt this, we can use that to create our first line.

start_x = 0
start_y = 1
end_x = 2
end_y = 0
Line( start_x, start_y, end_x, end_y)

Loops

We want to draw more than one line and that is why we need loops.

A loop works this way: You tell the computer to repeat a piece of code (all the text inside the curly-brackets) until a certain condition is met. To use a loop the command “while” is used in many programming languages.

counter=1
while (counter<=4){
   counter = counter+1
}

Here we create the variable counter. The variable “counter” is set to 4.
While the variable “counter” is smaller or equal to 4, repeat code in brackets{
“counter” is set to “counter” +1.
}

We create a variable counter and count with it to four. Afterwards, the condition in the loop is met and the loop ends.


And now we bring all what we have learnt together. We use the variables and the loop to create the graph we drew earlier.

start_x = 0
start_y = 1
end_x = 2
end_y = 0

counter=1

while (counter<=4){

   Line( start_x, start_y, end_x, end_y)

   start_y = start_y+1
   end_x = end_x+2

   counter = counter+1
}

Create the variables for the lines Set them according to the first line. “start_x”, “start_y”, “end_x”, “end_y”.

Set “counter” to 1.

Start loop. Loop continues as long counter is smaller or equal 4{

Draw a line from Point (start_x, start_y) to Point (end_x, end_y)

Set “start_y” to “start_y”+1

Set “end_x” to “end_x”+2

The variables “start_x” and “end_y” aren’t changed, because they stay the same in each loop for this example (compare with coordinates above)

Set “counter” to “counter”+1
}

The same lines, drawn by the little program above!

And the great things is, it is easy to play around with values, when you have written the program.

Why not 160 lines?

start_x = 0
start_y = 1
end_x = 2
end_y = 0

counter=1

while (counter<=160){

   Line( start_x, start_y, end_x, end_y)

   start_x = 0
   start_y = start_y+1
   end_x = end_x+2
   end_y = 0

   counter = counter+1
}

(The scale was changed to bigger steps)

Adding two lines each loop, changing the values

start_x = 0
start_y = 1
end_x = 2
end_y = 0

counter=1

while (counter<=160){

   Line( start_x, start_y, end_x, end_y)
   Line( end_x, 1000-start_y, 0, 0)

   start_x = 0
   start_y = start_y+4
   end_x = end_x+8
   end_y = 0

   counter = counter+1
}

Now we have a foundation to create generative art. After playing around with the values and adding 1 or 3 more lines each loop, I have created some interesting results. If you would add a nice looking frame, you could call it art.

(The quality suffered from compression)

I hope you learnt something. For feedback or if you want a second part with real code, let me know on Instagram or Twitter

Categories
Fun HowTo

Visualizing a Whatsapp-Conversation

In the last post I showed how I imported a Whatsapp-conversation and tidied it up a bit. Now I want to analyze it. For that I will use the libraries dplyr, stringr and ggplot2.

As a first step, I format the dates properly and create some new columns. I also decide to just focus on two years, 2016 and 2017.

data=data%>%mutate(
  #convert DAte to the date format.
        Date=as.Date(Date, "%d.%m.%y"),
        year = format(Date,format="%y"),
        hour =  as.integer(substring(Time,1,2))
        #I filtered for two year, 2016/17
        )%>%filter(year=='17'|year=='16')

ggplot(data,aes(x=hour))+
  geom_histogram(fill="brown",binwidth=1,alpha=0.9)+
  labs(title="Numbers of Messages by Hour", subtitle="Total of two Years",
       y="Number Messages", x="Hour")

See more about the writing behavior of me an my friend, there is more formatting necessary. The words need to be counted too. To do so I use the stringr-library with str_count(data$Message, "\\S+")

Categories
Fun HowTo

Importing a WhatApp-Conversation in R

I recently saw some people on Reddit analyzing their chat-conversations and I wanted to try it too. You can export a Whatsapp-Conversation by sending it as an Email to yourself. You will receive a txt-File with all the conversations. Because it isn’t formatted in a useful manner, you have to do it yourself. I will do this in this post and analyse the data in a second one. So this will be a bit more technical than usual. You can find the complete code here.