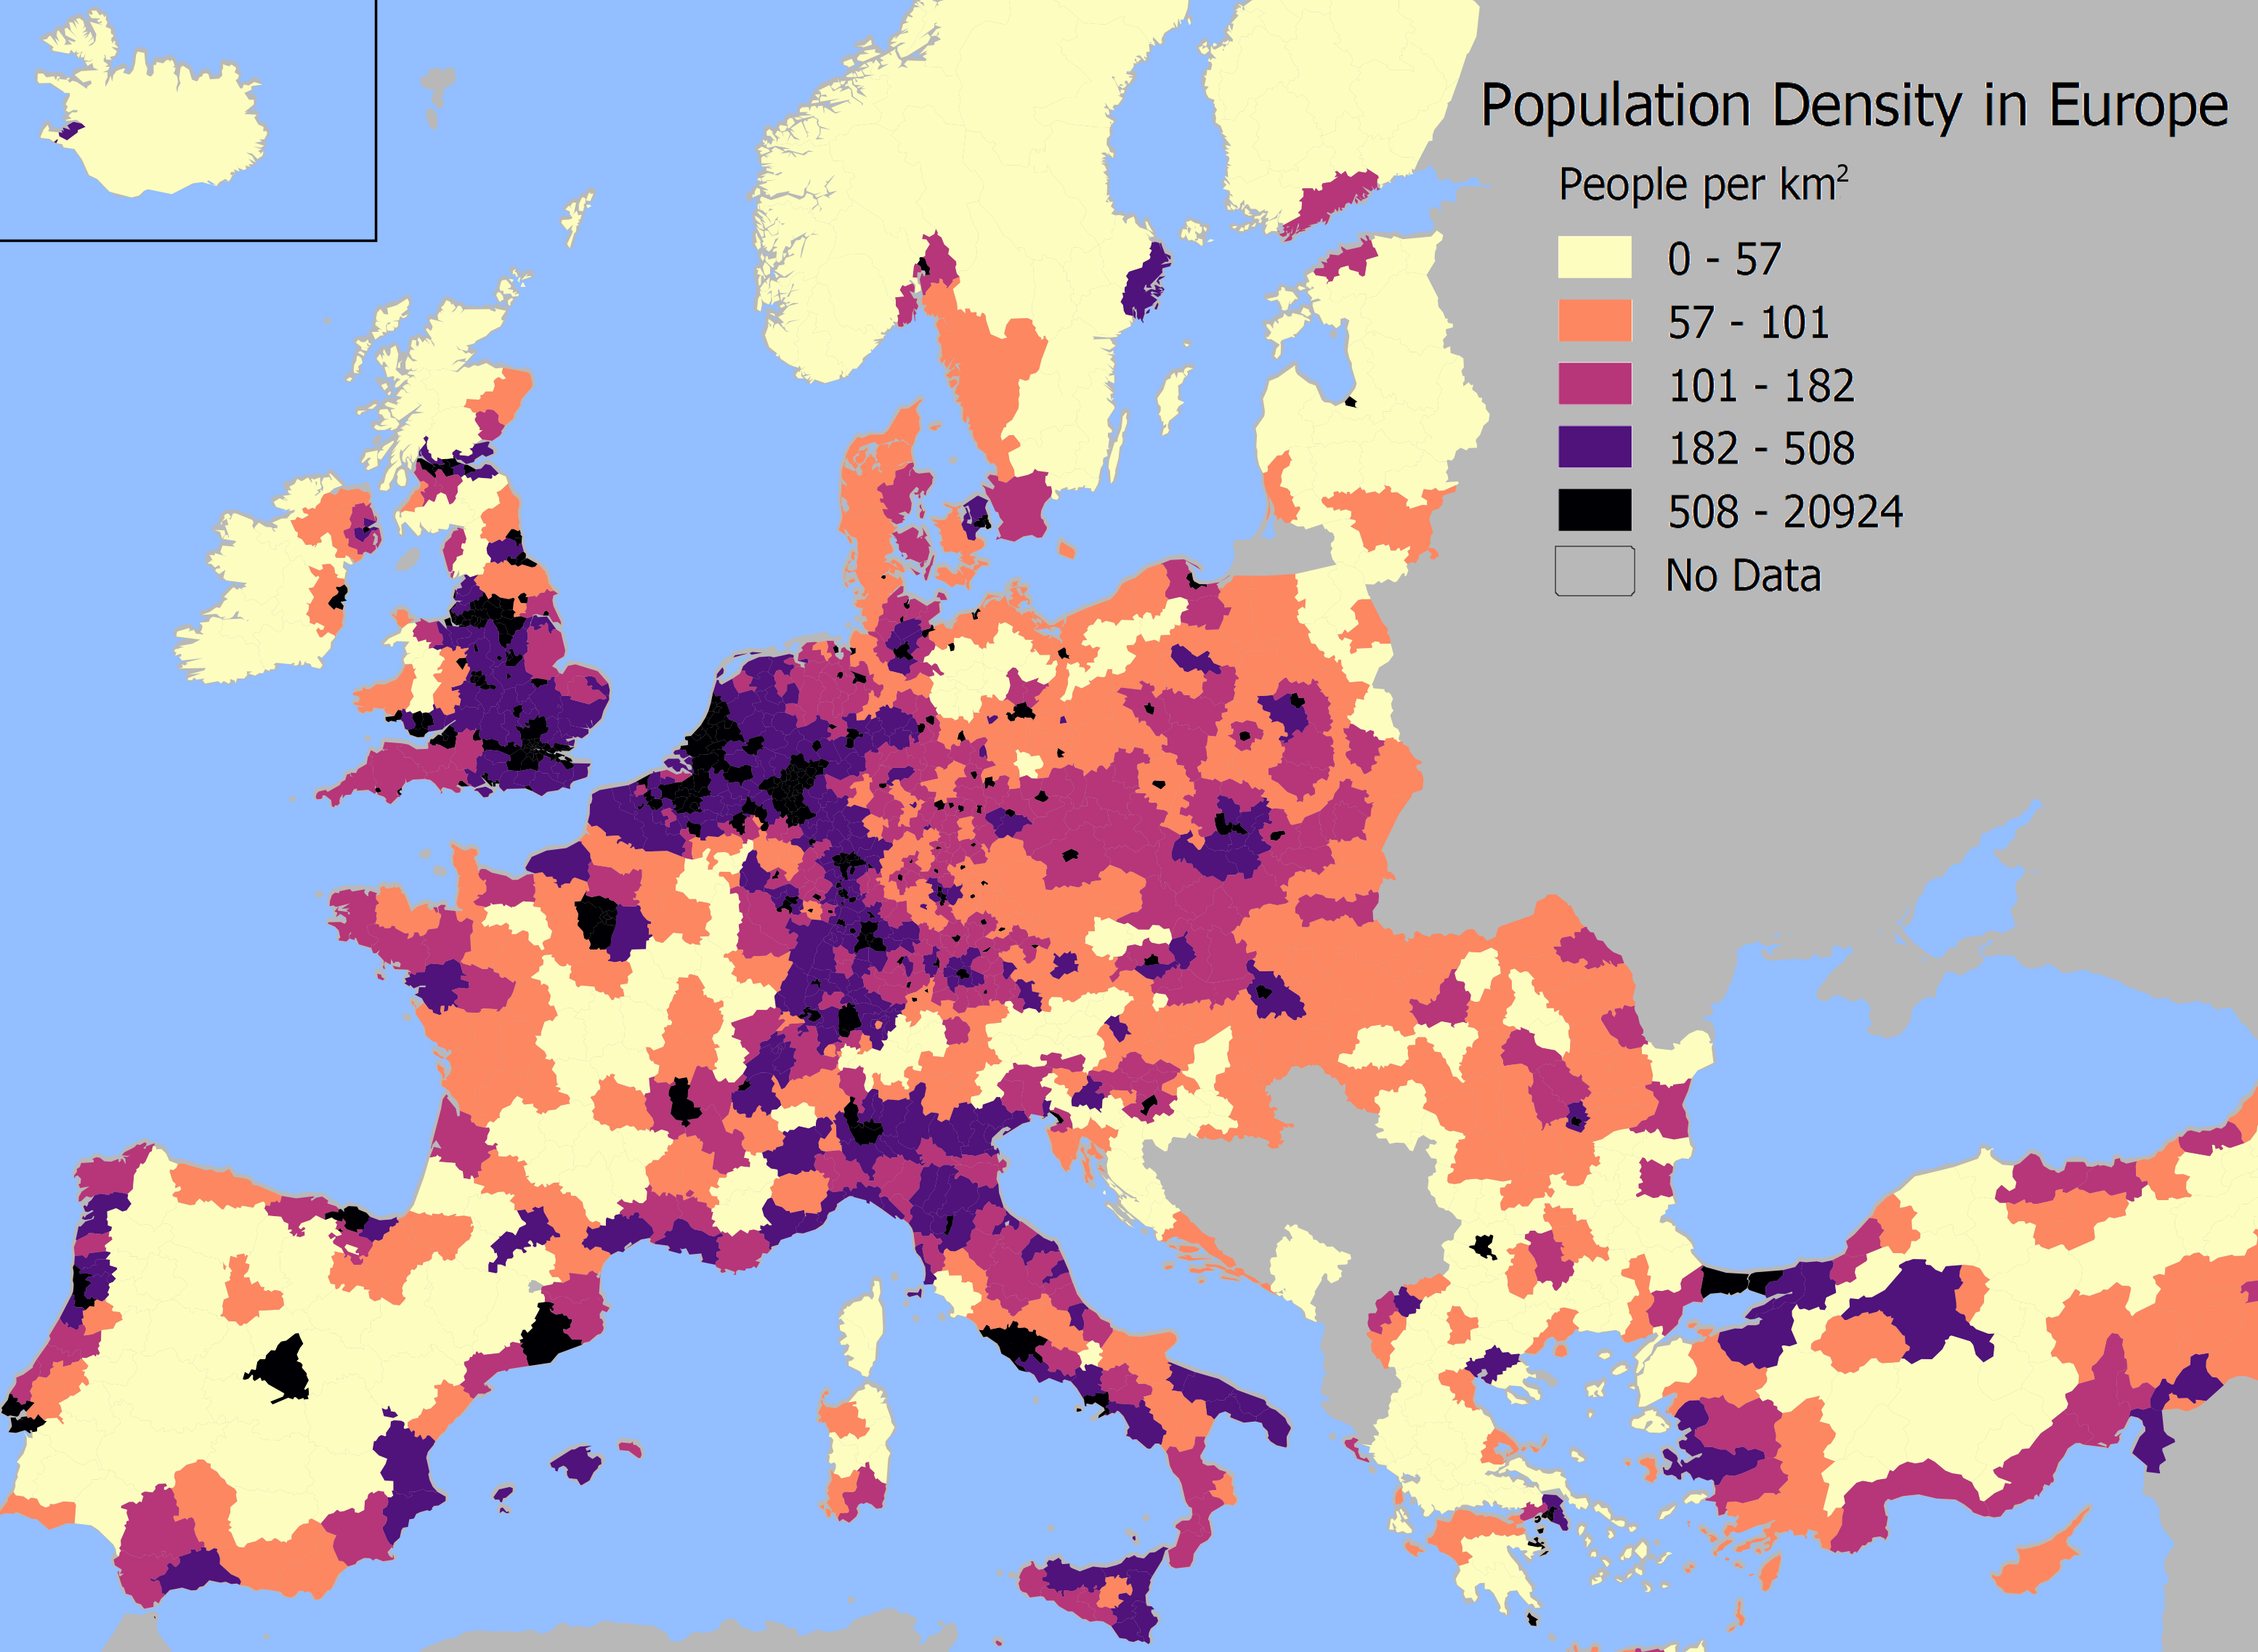
This map was made with the help of the data of Eurostat. The subdivisions of the countries follows NUTS 3 standards. I used a quantil-scale, which means each colors has about the same number of regions.
I got some feedback, that I maybe should have used a Log-scale. I tried that, but I prefer the look of the first one.
Here the list of the 25 densest territories in Europe.
| NUTS 3 | Name | Population per km2 |
| FR101 | Paris | 20923.6 |
| UKI42 | Tower Hamlets | 14590.3 |
| UKI45 | Lambeth | 11977.6 |
| UKI33 | Kensington and Chelsea & Hammersmith and Fulham | 11629.7 |
| UKI32 | Westminster | 11376.6 |
| UKI43 | Haringey & Islington | 11323.9 |
| UKI41 | Hackney & Newham | 10907.6 |
| EL303 | Kentrikos Tomeas Athinon | 10686.5 |
| RO321 | Bucuresti | 9993.8 |
| UKI31 | Camden & City of London | 9939 |
| UKI44 | Lewisham & Southwark | 9454.6 |
| UKI34 | Wandsworth | 9307.4 |
| FR105 | Hauts-de-Seine | 9142.1 |
| UKI72 | Brent | 7556 |
| BE100 | Arr. de Bruxelles-Capitale / Arr. van Brussel-Hoofdstad | 7408 |
| EL304 | Notios Tomeas Athinon | 7391.3 |
| EL302 | Dytikos Tomeas Athinon | 7206.2 |
| FR106 | Seine-Saint-Denis | 6743.4 |
| ES640 | Melilla (ES) | 6513.3 |
| UKI73 | Ealing | 6192.8 |
| UKI53 | Redbridge & Waltham Forest | 6009.2 |
| FR107 | Val-de-Marne | 5638.4 |
| UKJ31 | Portsmouth | 5289.1 |
| CH031 | Basel-Stadt | 5167.5 |