Categories
Map Travel

Where have I been in 2018

Last year I made a post about where I have been in 2017. I was worse with R so I solved it with a combination of cleaning up the data with R, importing it into Qgis and finally edited it in HitFilms.

This time I just did it all in R. The difficult part this time was to get the Google API running for the import of Google maps. (You need to enable billing to get the whole thing running.) It was the first time I used the new ggAnimate. It is great and easy to use. Less of a hazzle then the last times I used it.

I could reuse some of last years code, so I was done quite fast. (not the greatest code tough.)


library(tidyverse)
library(jsonlite)
library(ggplot2)
library(ggmap)
library(gganimate)
library(gifski)
library(zoo)
library(lubridate)

register_google(key = “AIzaSyCTCk3yYCPEo1UKVkZm_iQk_r4wPJCHlA4”)

system.time(x <- fromJSON(“GoogleLoc.json”))

# extracting the locations dataframe
loc = x$locations

# converting time column from posix milliseconds into a readable time scale
loc$time = as.POSIXct(as.numeric(x$locations$timestampMs)/1000, origin = “1970-01-01”)

# converting longitude and latitude from E7 to GPS coordinates
loc$lat = loc$latitudeE7 / 1e7
loc$lon = loc$longitudeE7 / 1e7

# calculate the number of data points per day, month and year
loc$date <- as.Date(loc$time, ‘%Y/%m/%d’)
loc$year <- year(loc$date)
loc$month_year <- as.yearmon(loc$date)

#new dataframe with the important units
maps<- data.frame(loc$lat,loc$long,loc$date,loc$time,loc$year)

#filter out the year and convert the longitude to the proper unit.
maps1<-maps%>%filter(loc.year==2018) %>% mutate(longitude = loc.long/10^7)

#choose the 10. measurement of each day. not very elegant, but good enough.
maps2<- maps1 %>% group_by(loc.date) %>%
summarise(long=(longitude[10]),
lat=(loc.lat[10]))

#get background map. set size, zoom, kind of map)
mamap <- get_map(location=c(mean(maps2$long,na.rm=T),mean(maps2$lat,na.rm=TRUE)+3), maptype = “satellite”,zoom=5)

#put it all together.
ggmap(mamap)+
geom_point(data=maps2,aes(x=long,y=lat),size=4, col=”red”)+
geom_label(data=maps2,x=1.5,y=56,aes(label=format(as.Date(loc.date),format=”%d.%m”)),size=10,col=”black”)+
theme_void()+
#the animation part
transition_time(loc.date)+
shadow_trail(alpha=0.3,colour=”#ff695e”,size=2,max_frames = 6)

a=animate(m, renderer = ffmpeg_renderer(),duration=20)
anim_save(filename = “my2018/2018video.mp4”)
Categories
Germany History Map Switzerland United States

American Cities named after big German, Austrian or Swiss Cities

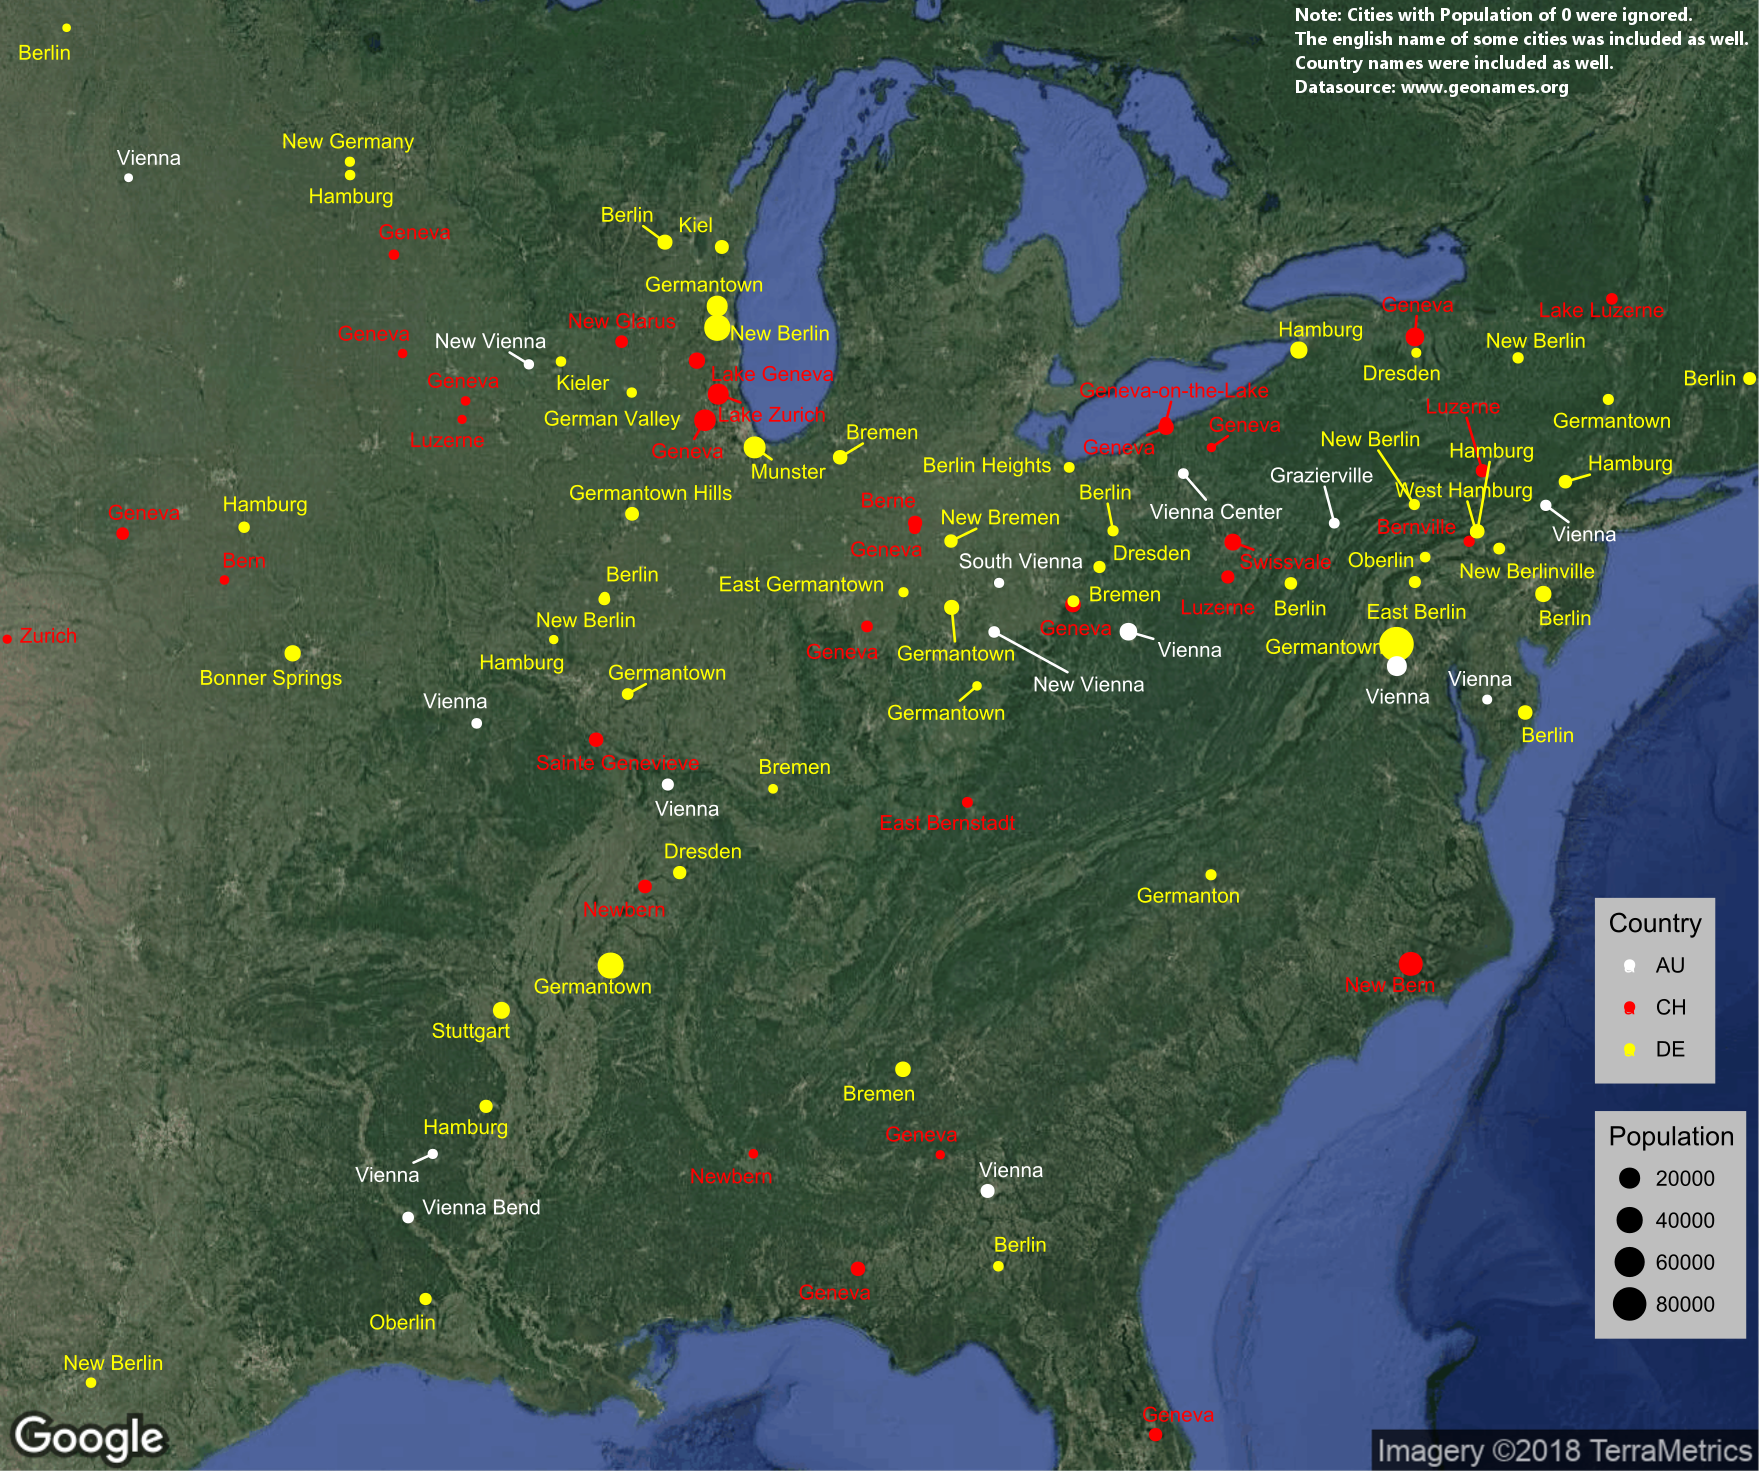
Recently the Swiss ambassador in the United States posted an interesting tweet. It showed a map of places in the US which might have Swiss roots. A little later I found the same map on Reddit too. Reading the discussion and after checking some things myself, I noticed that there were mistakes or the cities weren’t existing anymore. Unfortunately, the ambassador didn’t share any source.

The map made me curious and I thought to check myself. I downloaded a list of places in the United States and Canada from www.geonames.org. I imported it into R and filtered it just for the cities and town.

I then created three lists with search-term for Germany, Switzerland and Austria. For Switzerland I used the names of the Kantons, for Germany the names of the 30 biggest cities and for Austria I took the 10 biggest cities and the name of some of the regions. I also translated some names of more famous places to English. I had to do some filtering because a name like “Uri” just gives a ton of wrong results. I then used the search-terms to look through the cities in the US and Canada.

The first result was, that a big part of cities were dead an had a population of zero. I think it was more than half. I had no clue, that there were so many empty towns in the US. I decided to filter those out, because it cluttered everything. Then I had to filter some more for names like “BERNard” and in the end, I went manually trough the list to remove false positives.

After that I just had to visualize it. I used the packages ggplot, ggrepel and ggmap to create the map. I finished it in Gimp. If anyone is interested in the code let me know.

Categories
Map Politics Switzerland Uncategorized

Women’s suffrage in Switzerland at the cantonal level

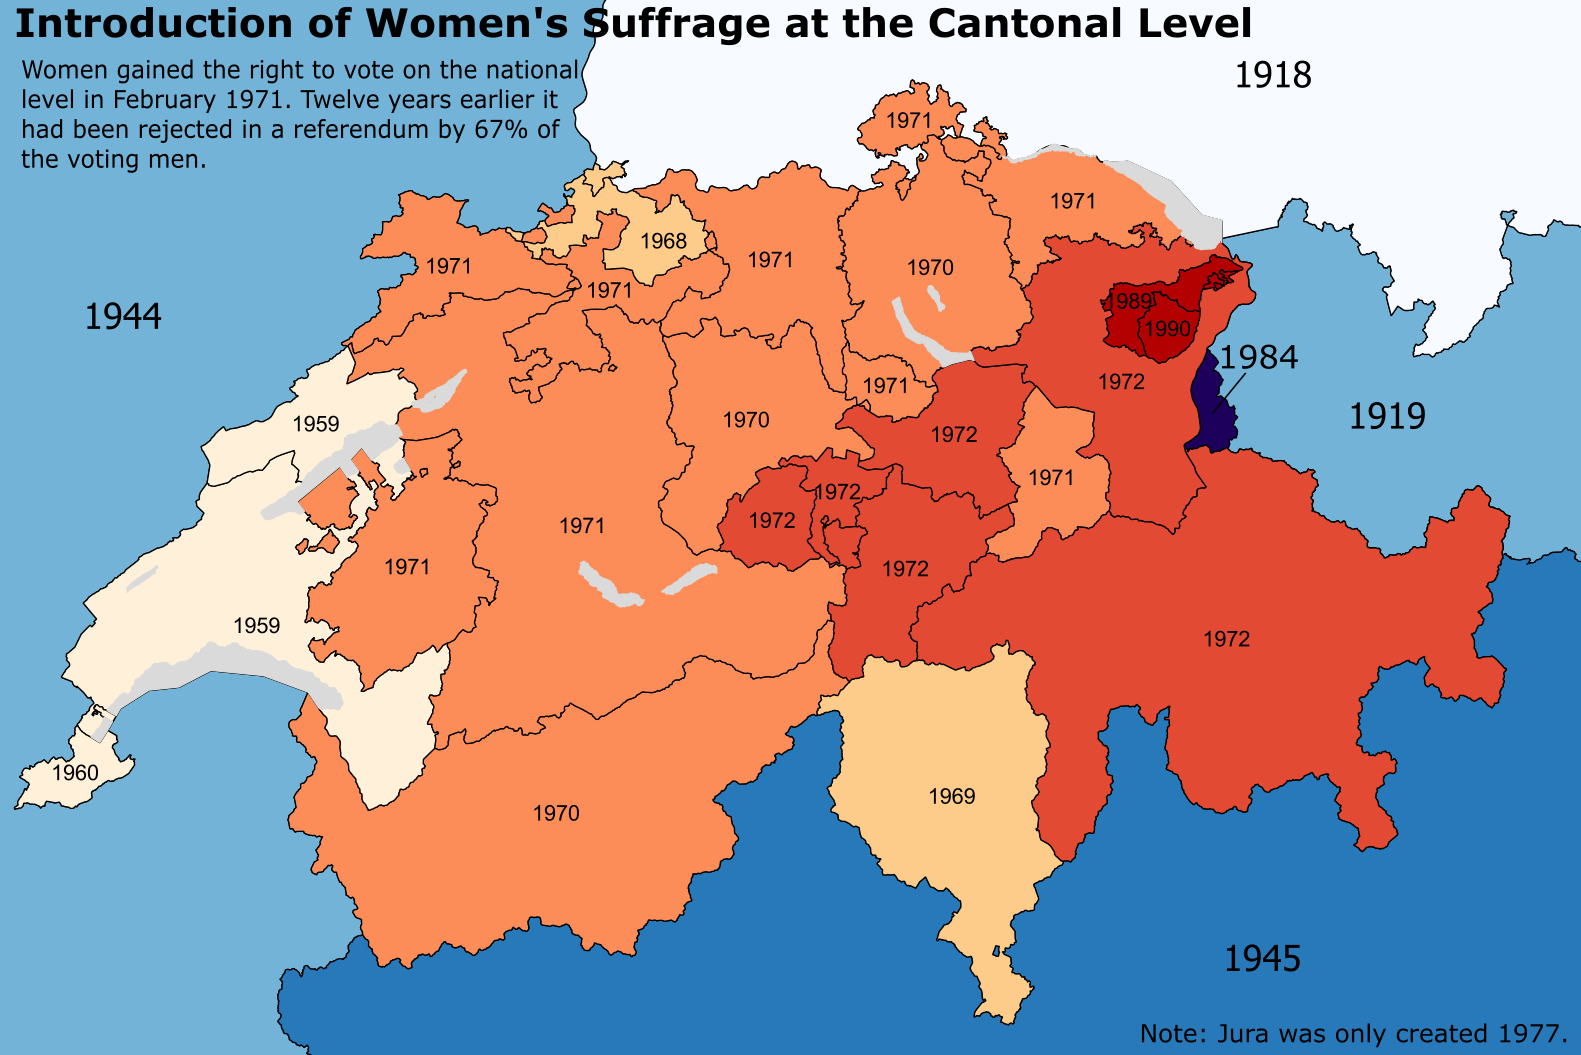
There are several reasons women in Switzerland gained the right to vote only in 1971. The main reason is the direct democracy. There had to be a referendum to give women the right to vote. It’s quite likely that many countries would have introduced the women suffrage later.

Categories
Europe Fun Map Population

A dot-map of Europe

This map is a more leaning on the aesthetic- then data-side. The size of the dots correlates with the size of the population in that place. The color has no meaning and is just there to look nice. For the division of places I used the NUT3 standard which is quite useful, but has its problems if you use it to compare countries.

Categories
Map Switzerland

The Trams of Zurich animated

After I saw a great post on /r/dataisbeautiful where someone mapped a place with the help of location-data of rented bicycles, I searched if there is some similar data available where I live.

Categories
Europe Fun Map

Where have I been in 2017

I created this animation in the first days of 2018. A few years ago I accepted that most of my data is stored somewhere. Instead of avoiding this like before, I started to embrace it. In Google Locations for example all the places where you have been are stored (if you didn’t disable it). It can be quite useful to remember what you did a certain day.

This data can also be downloaded and analysed. I didn’t do that, I just wanted to make a nice animation. To do thso at I imported the data it into R with the help of the json-Library. I just chose one value for each day and exported that new data. The next steps could have been done in R too, but I was less experienced with the program back then.

I imported the data to QGIS instead. With the help of the TimeManager-Plugin I exported a frame for each day. I loaded those into Hitfilms Express, which is a fantastic free video-editing software. I used gifmaker.me before to create Gifs, but they have a limit of 300 frames. I exported the video and uploaded it to Gfycat. And here it is.


Categories
Europe Map

Population Density in Europe

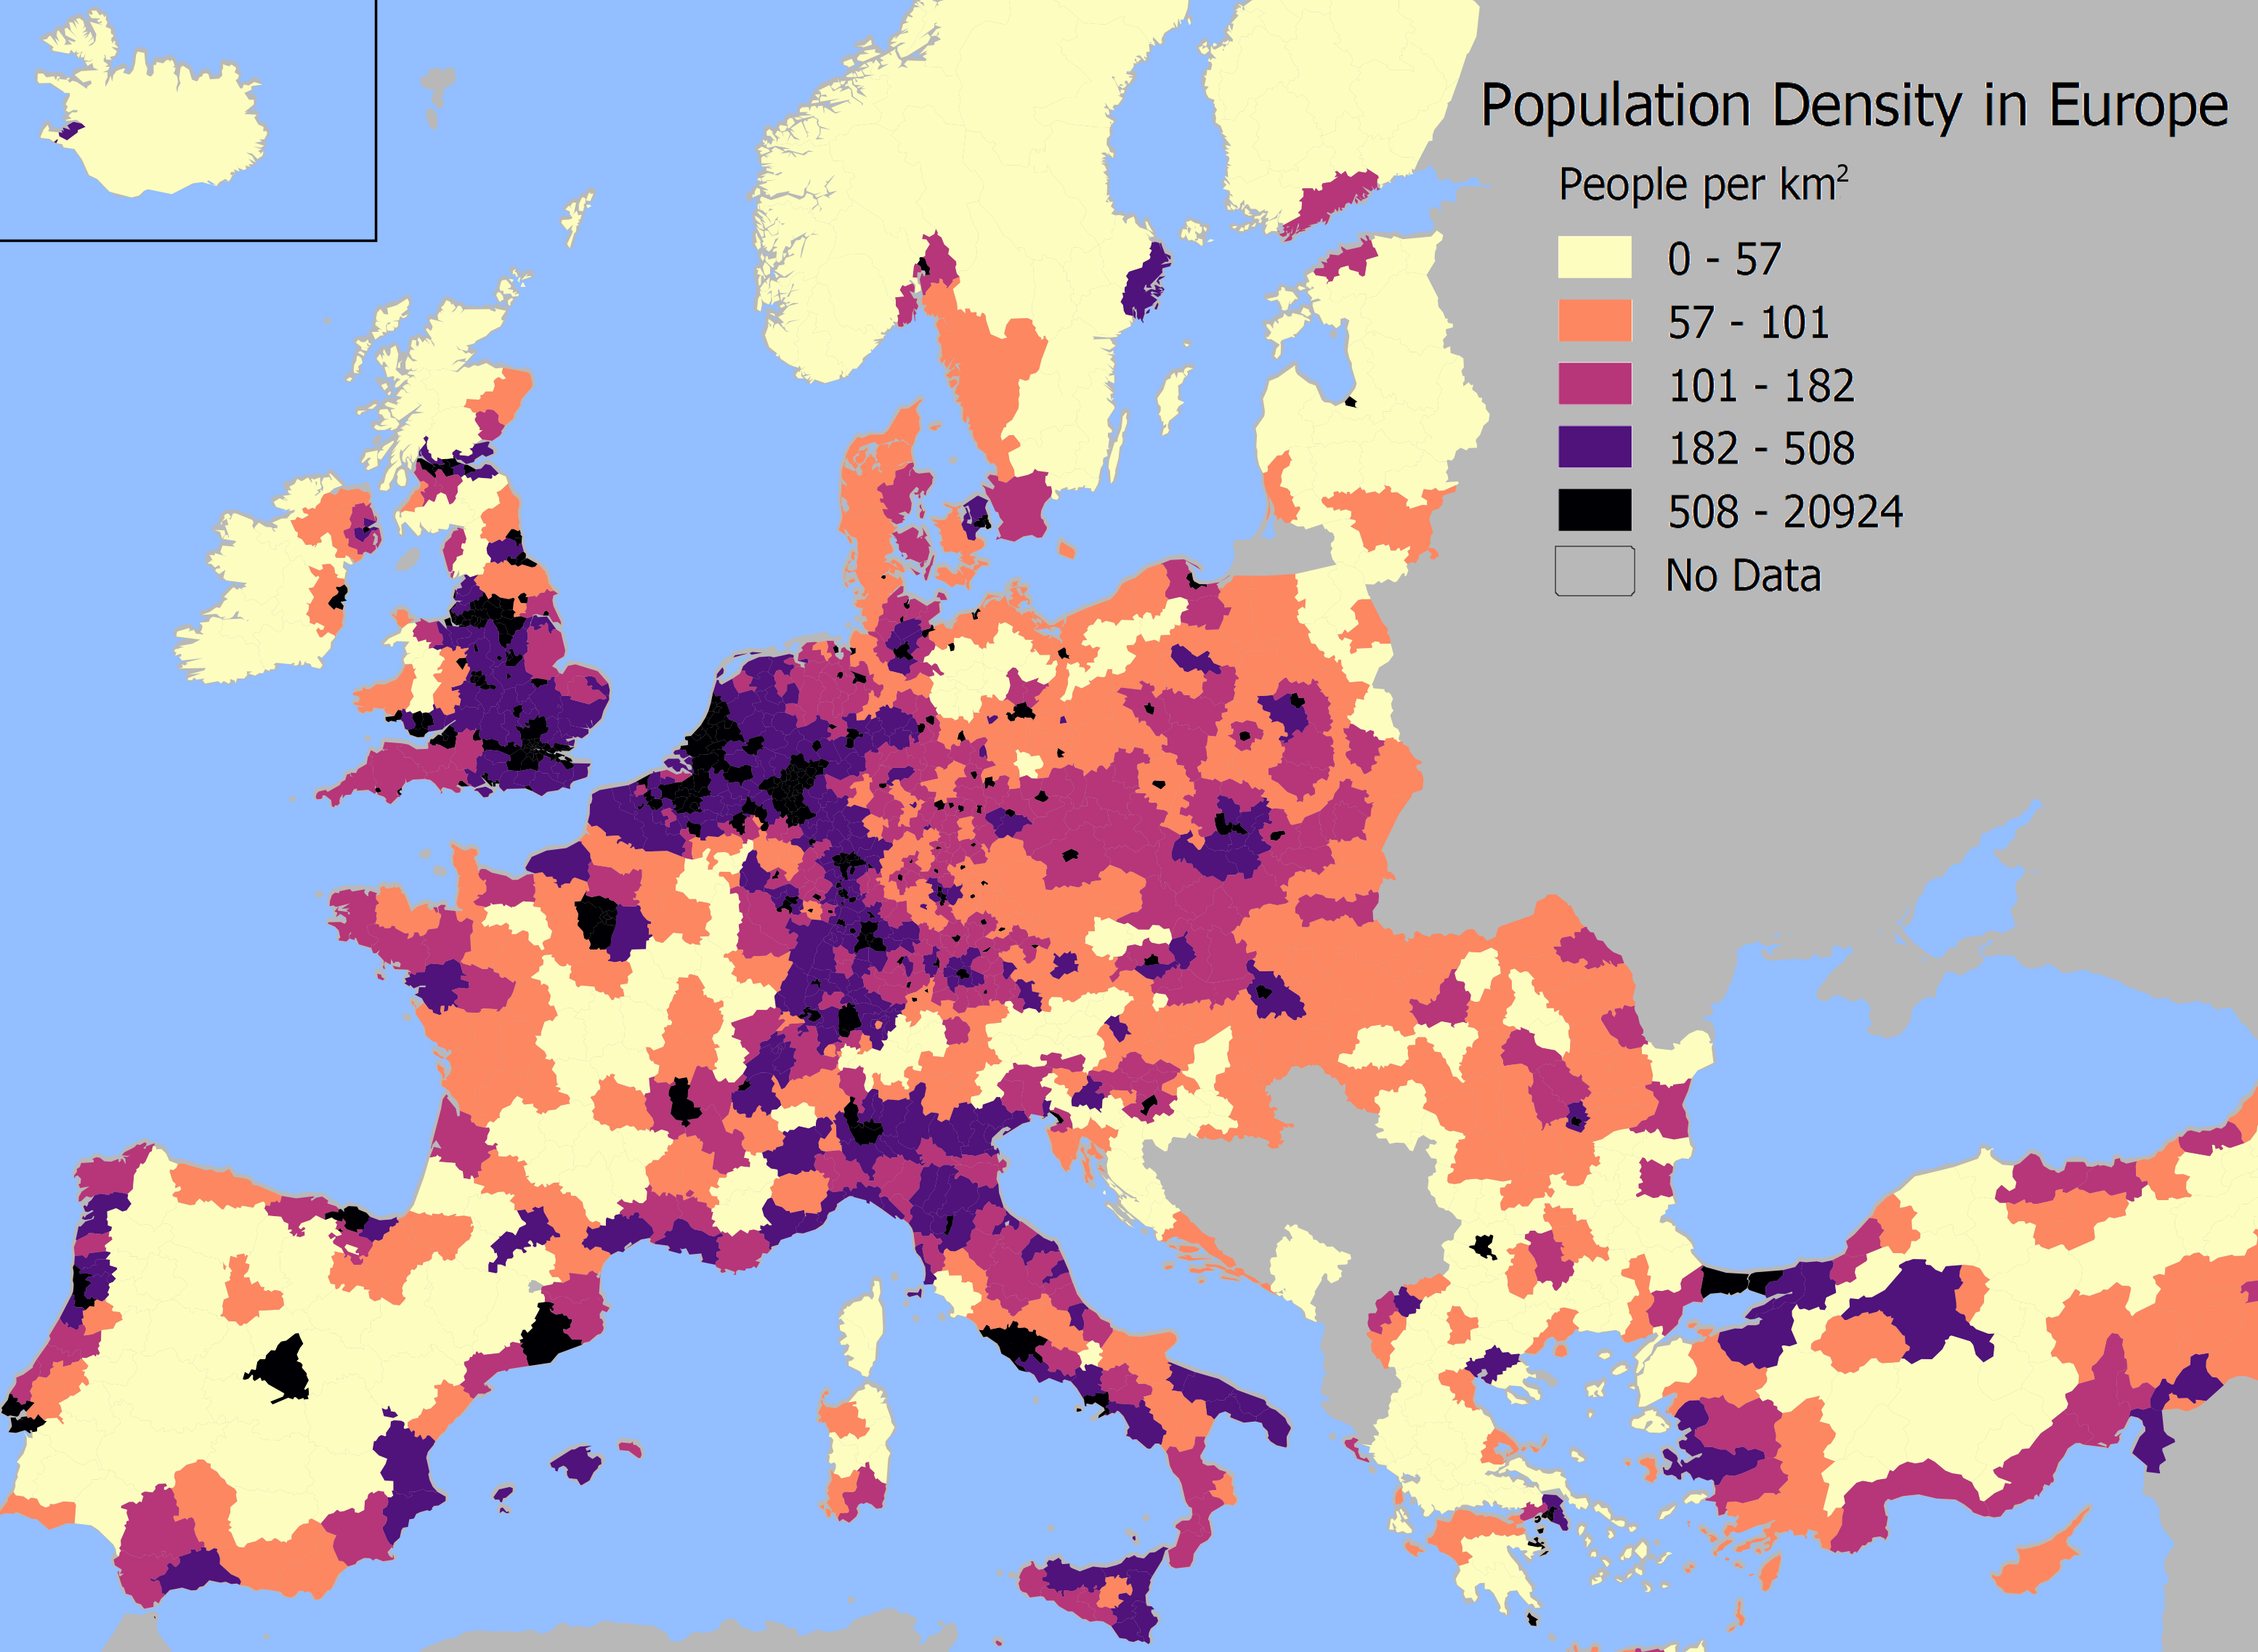
This map was made with the help of the data of Eurostat. The subdivisions of the countries follows NUTS 3 standards. I used a quantil-scale, which means each colors has about the same number of regions.

Categories
Map World

Share of women in parliaments all over the world

The worldwide average for representation of women in national parliaments is about 21 percent. This number isn’t great. But 1990 the average was about 10 percent. We made at least some progress, even though there is a lot of space for improvement. Even in Europe with the highest average it’s just about a quarter.

Categories
Europe Map

How much do the countries of Europe invest in R&D?

I created this map some weeks ago with a dataset from the OECD. I wanted to visualize the role of research and development (R&D) in different European countries. The results aren’t to surprising: There seems to be a correlation with the wealth of the country. Switzerland is the country which spends the most on R&D.

Colors and the number of the countries have a different meaning, which is rather confusing.  I tried to put more information on the map, but I have to think of a better way in the future. And I made two mistakes: I didn’t show clearly  that the was no data for Ireland and I used a map-shapefile which labeled the Krim as Russian territory.